The status page that keeps your infrastructure private.
Keep your customers informed about incidents and maintenance. Compose public services from Icinga 2, Uptime Kuma, openITCockpit or webhooks — without ever exposing check names or hosts.
Start with Docker Compose
docker compose up -d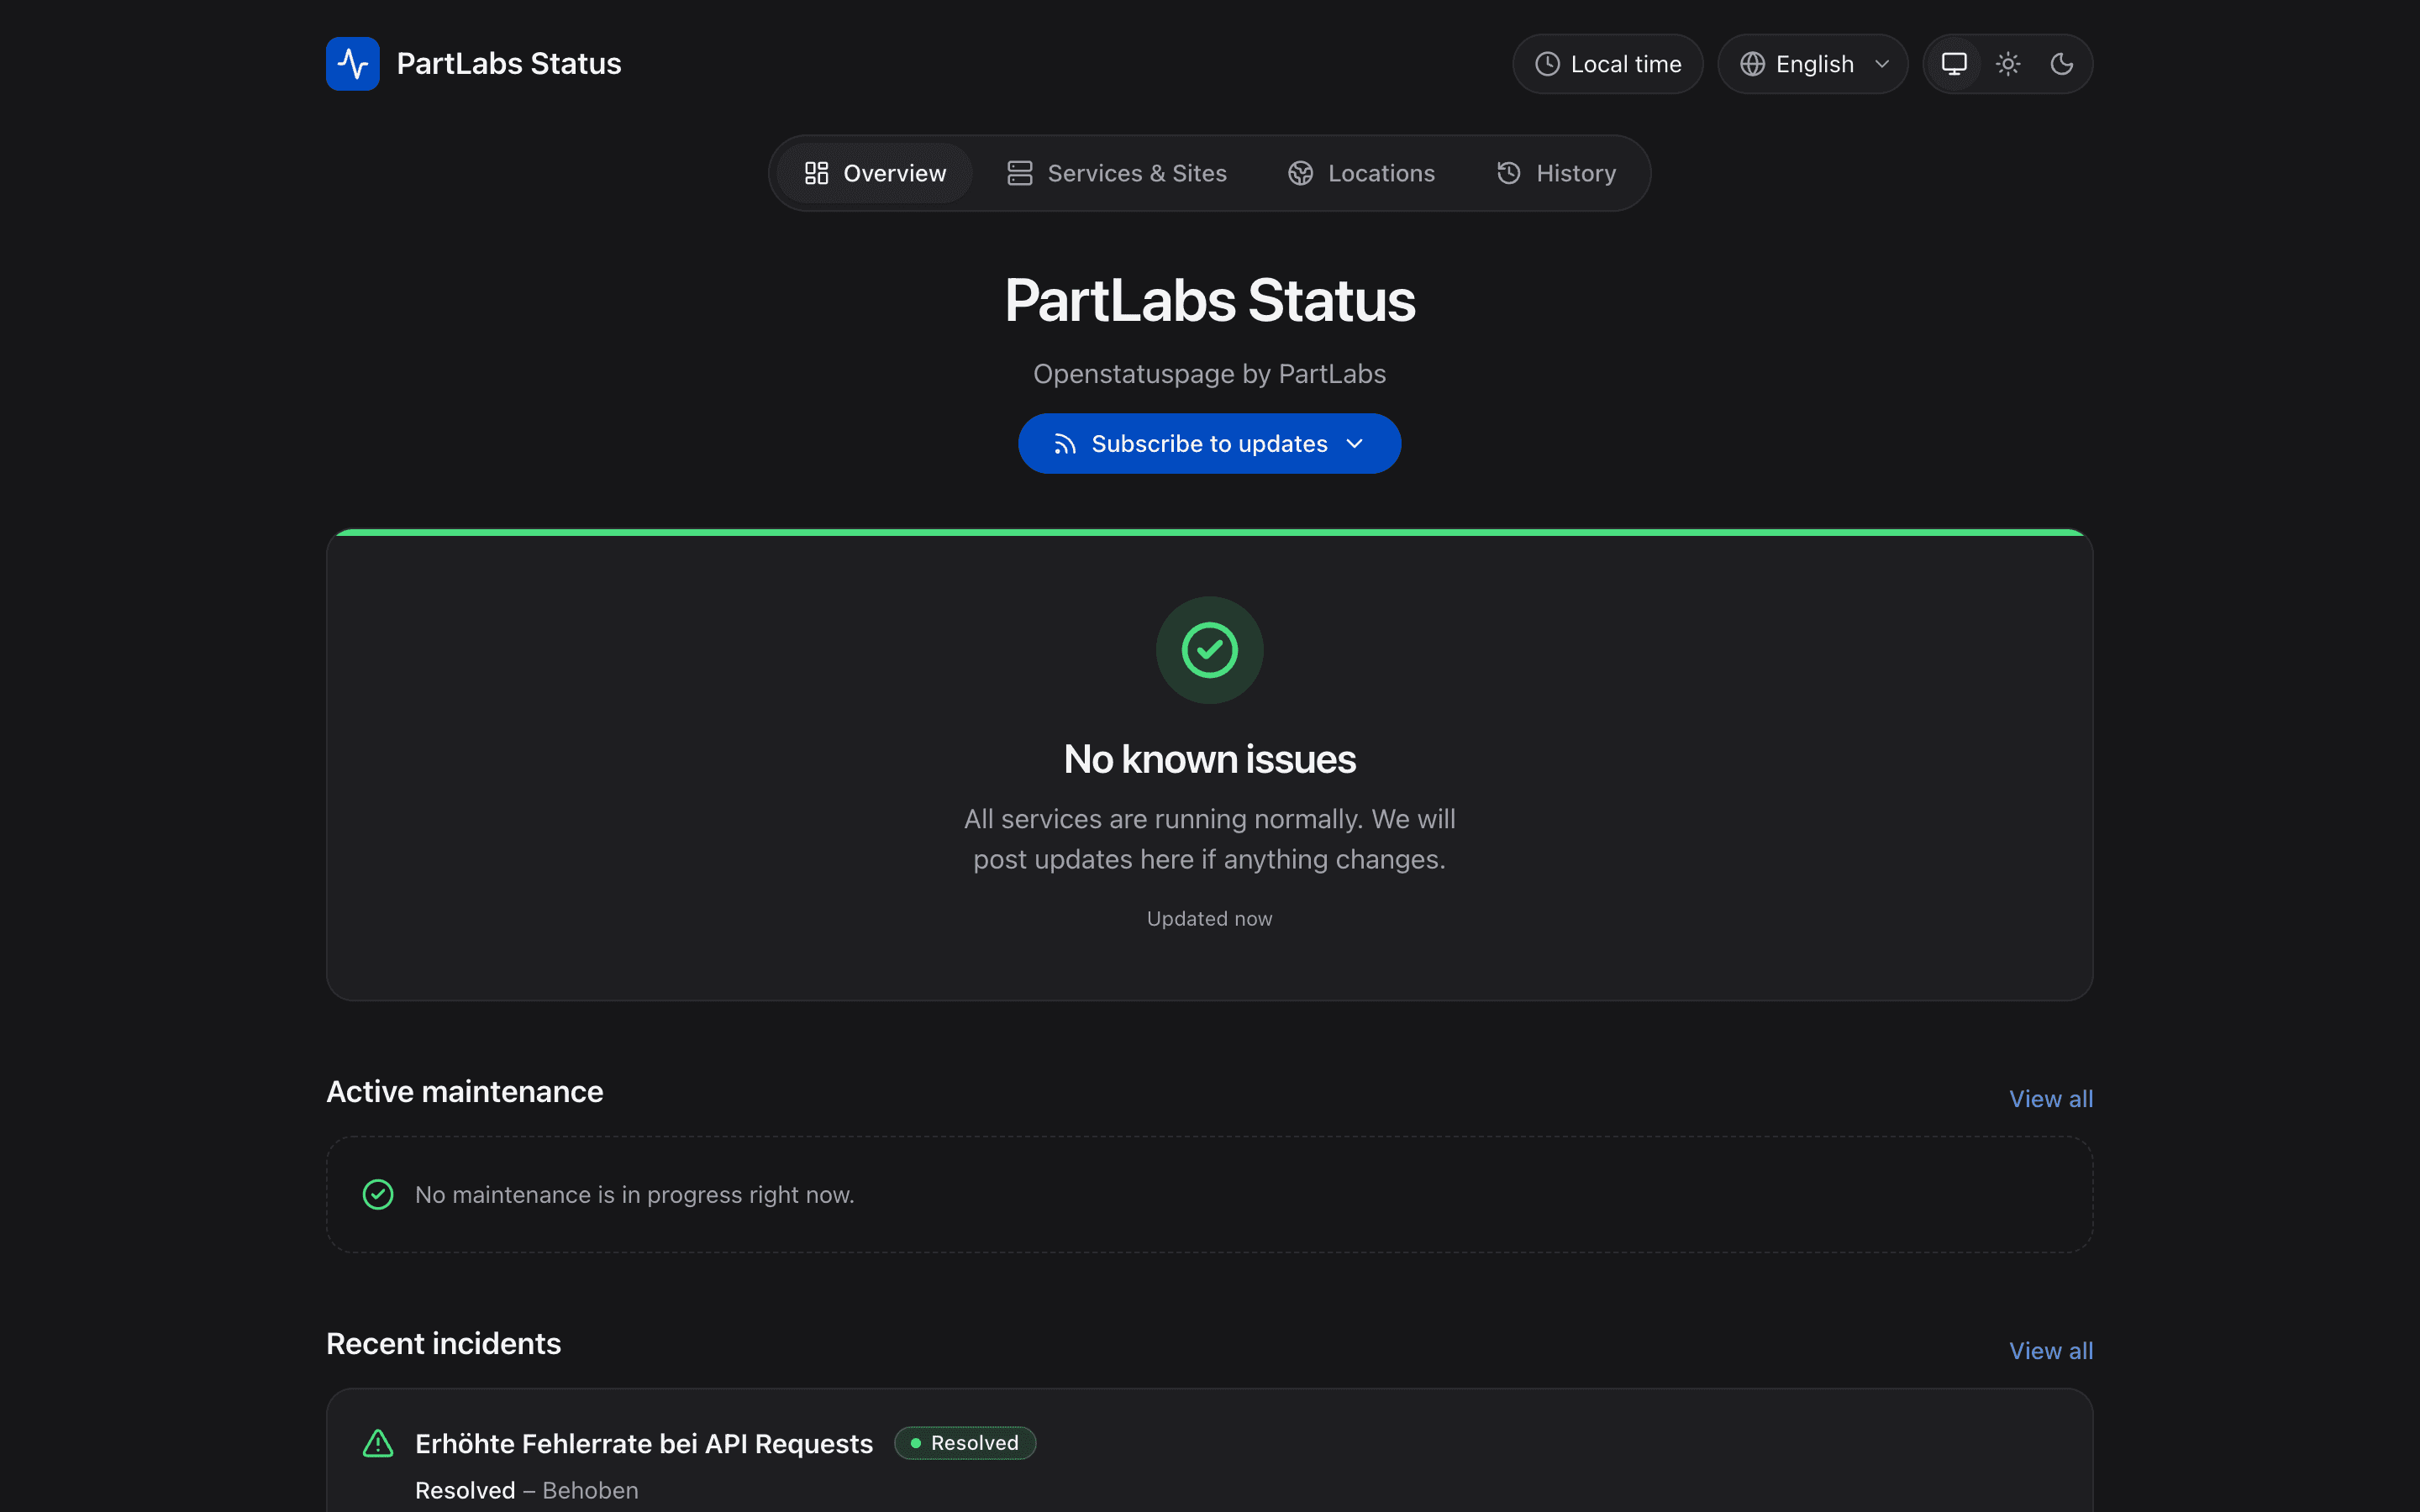
Product tour
A status page your visitors actually understand
Clear pages for the public, built from the checks you already run. Take a look around.
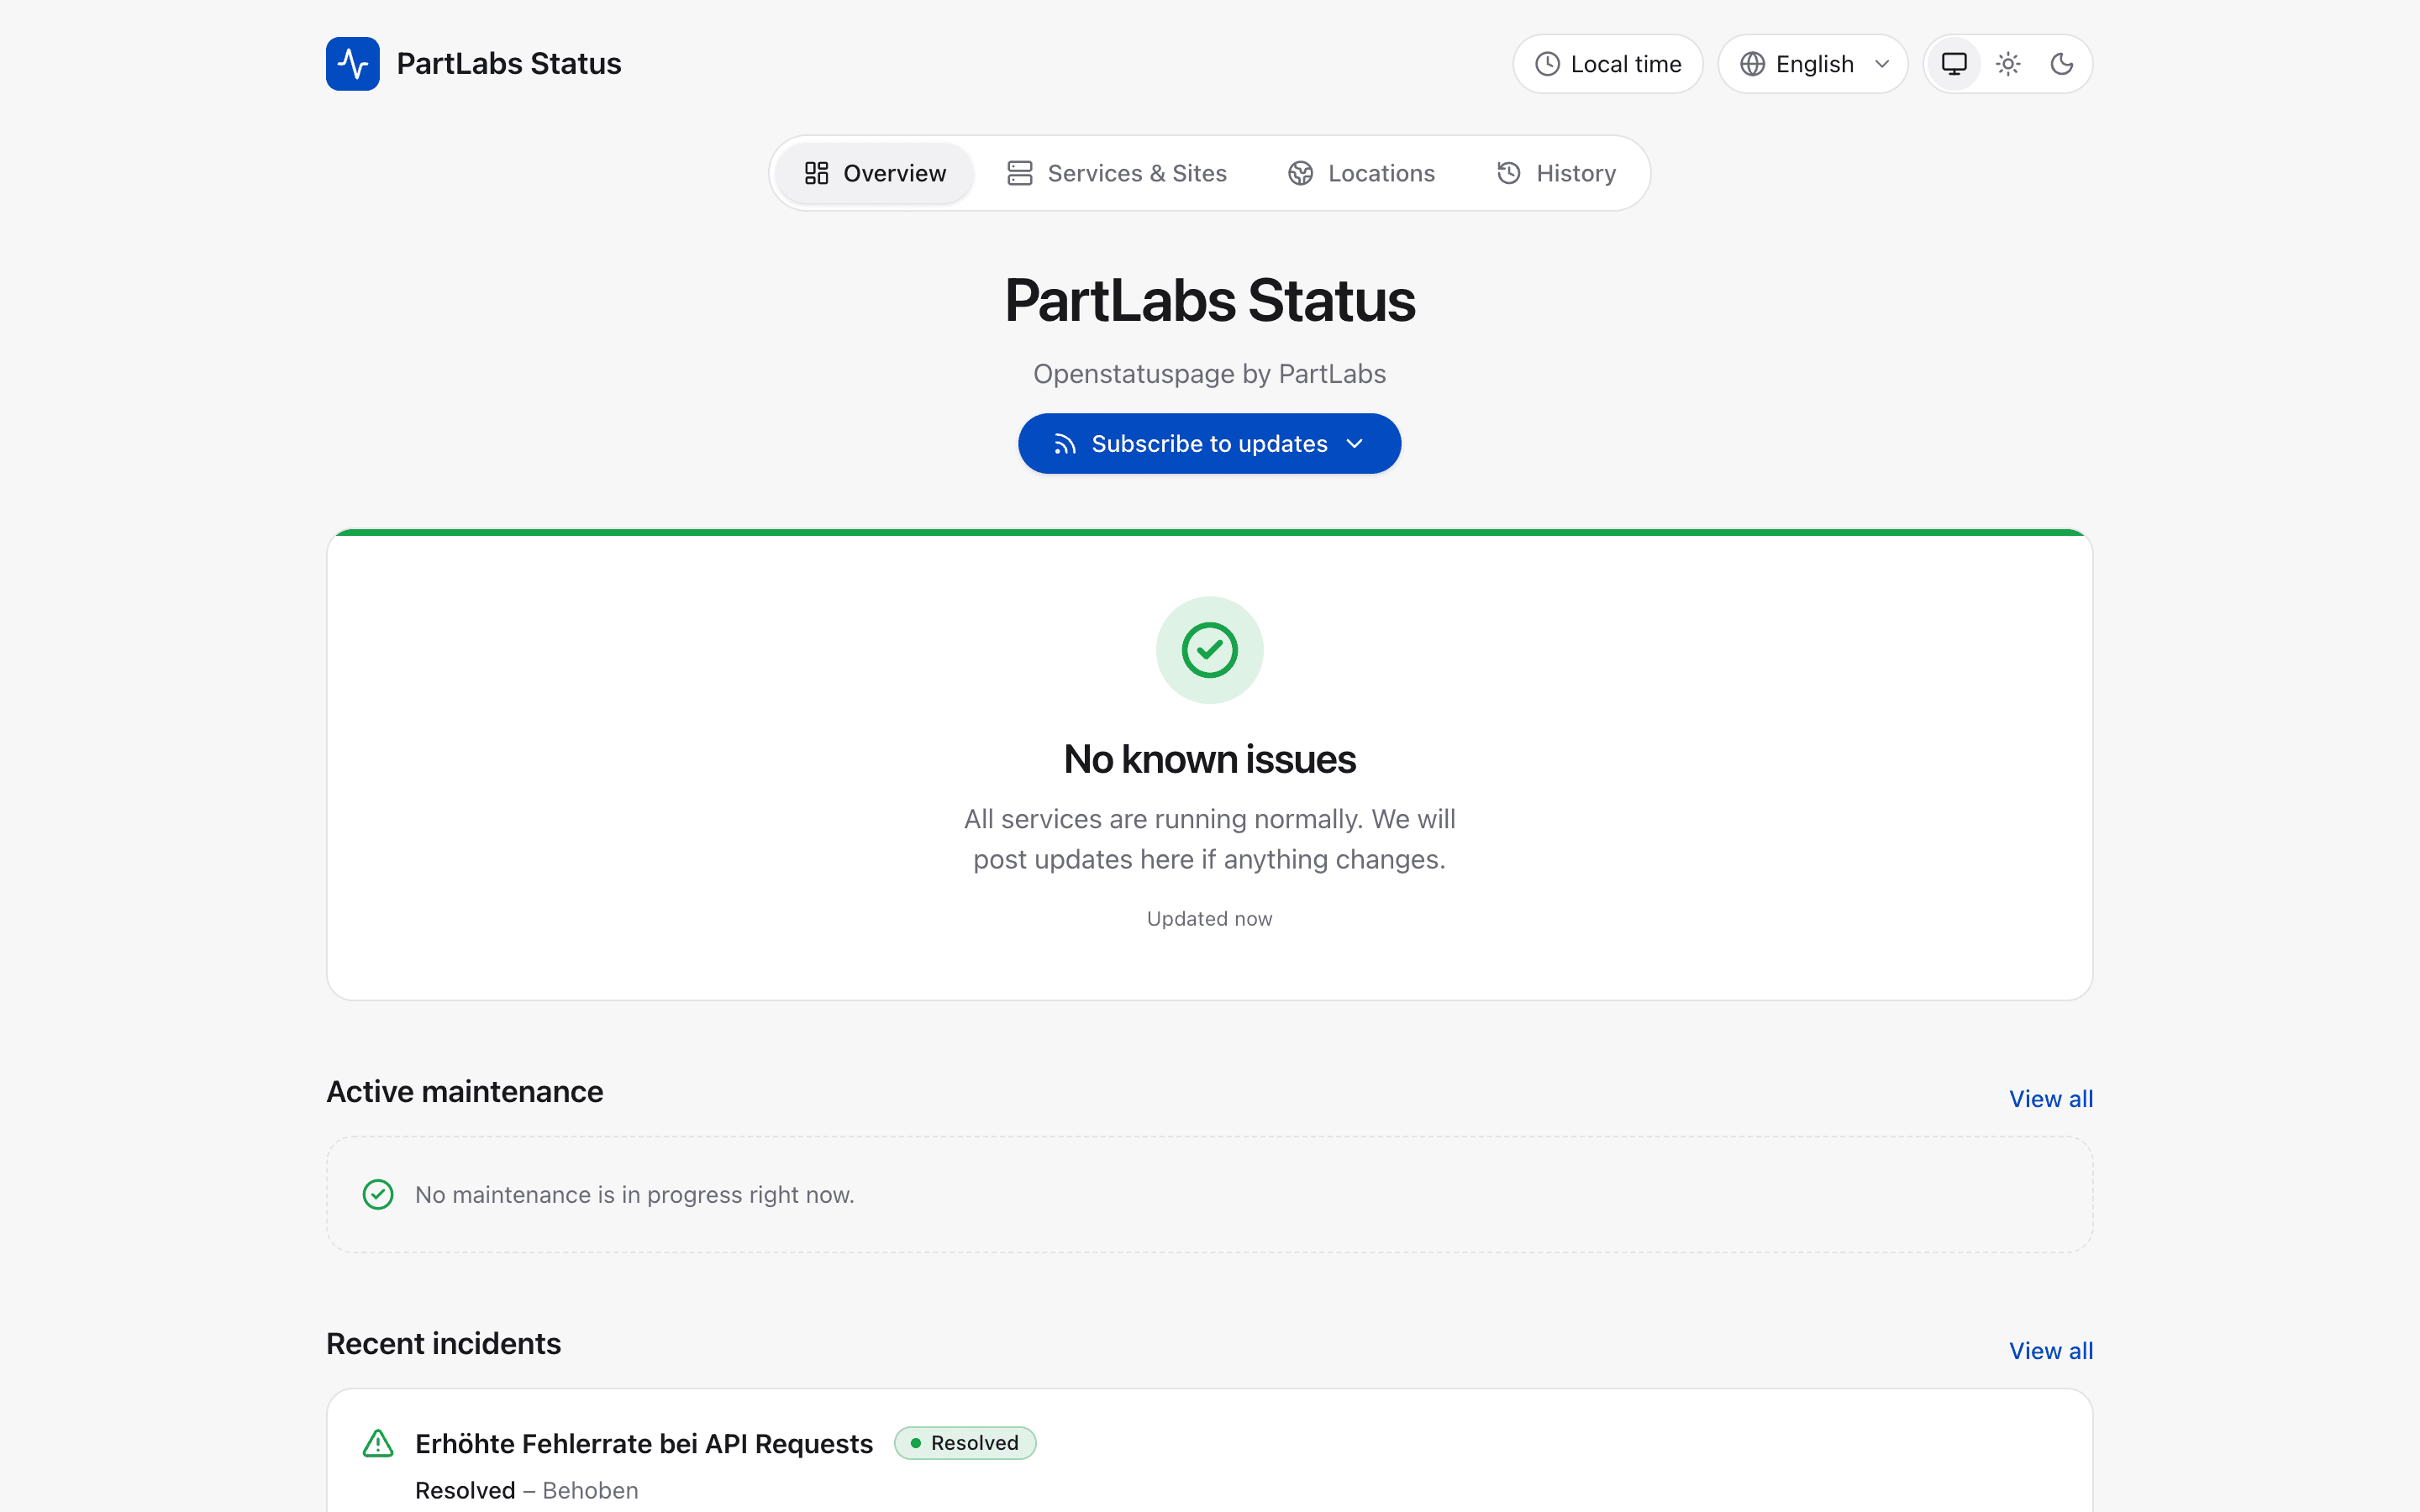
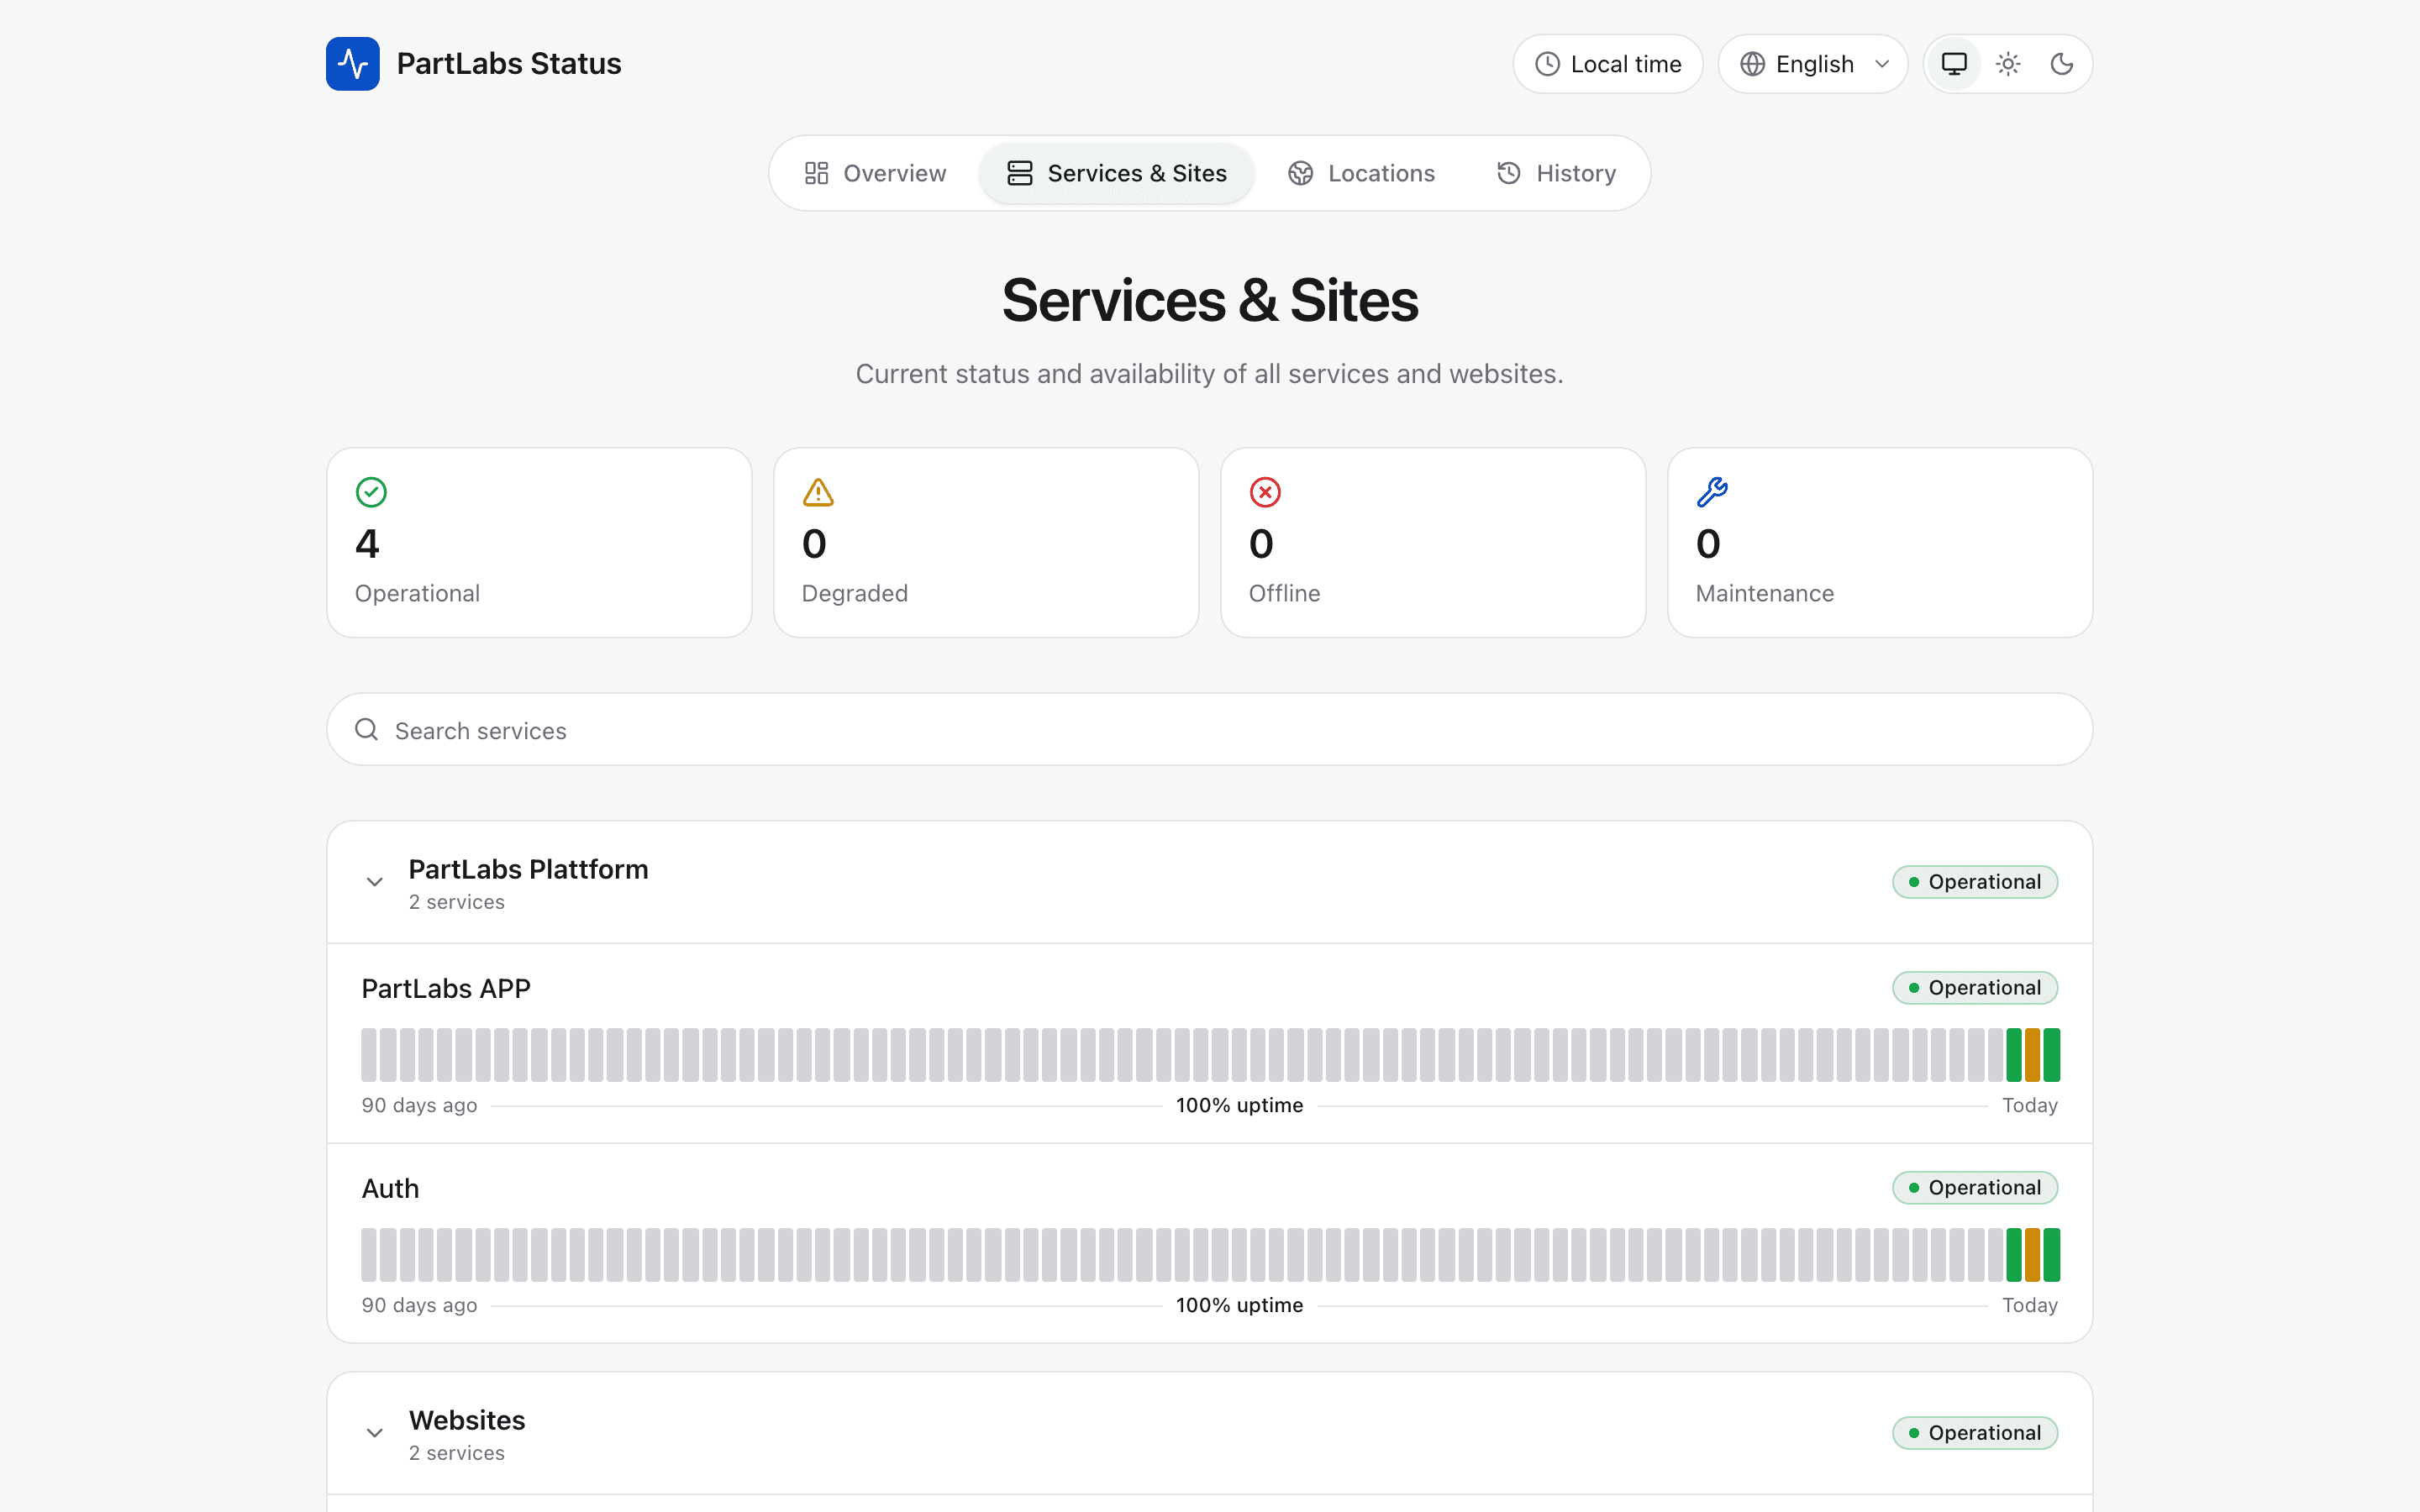
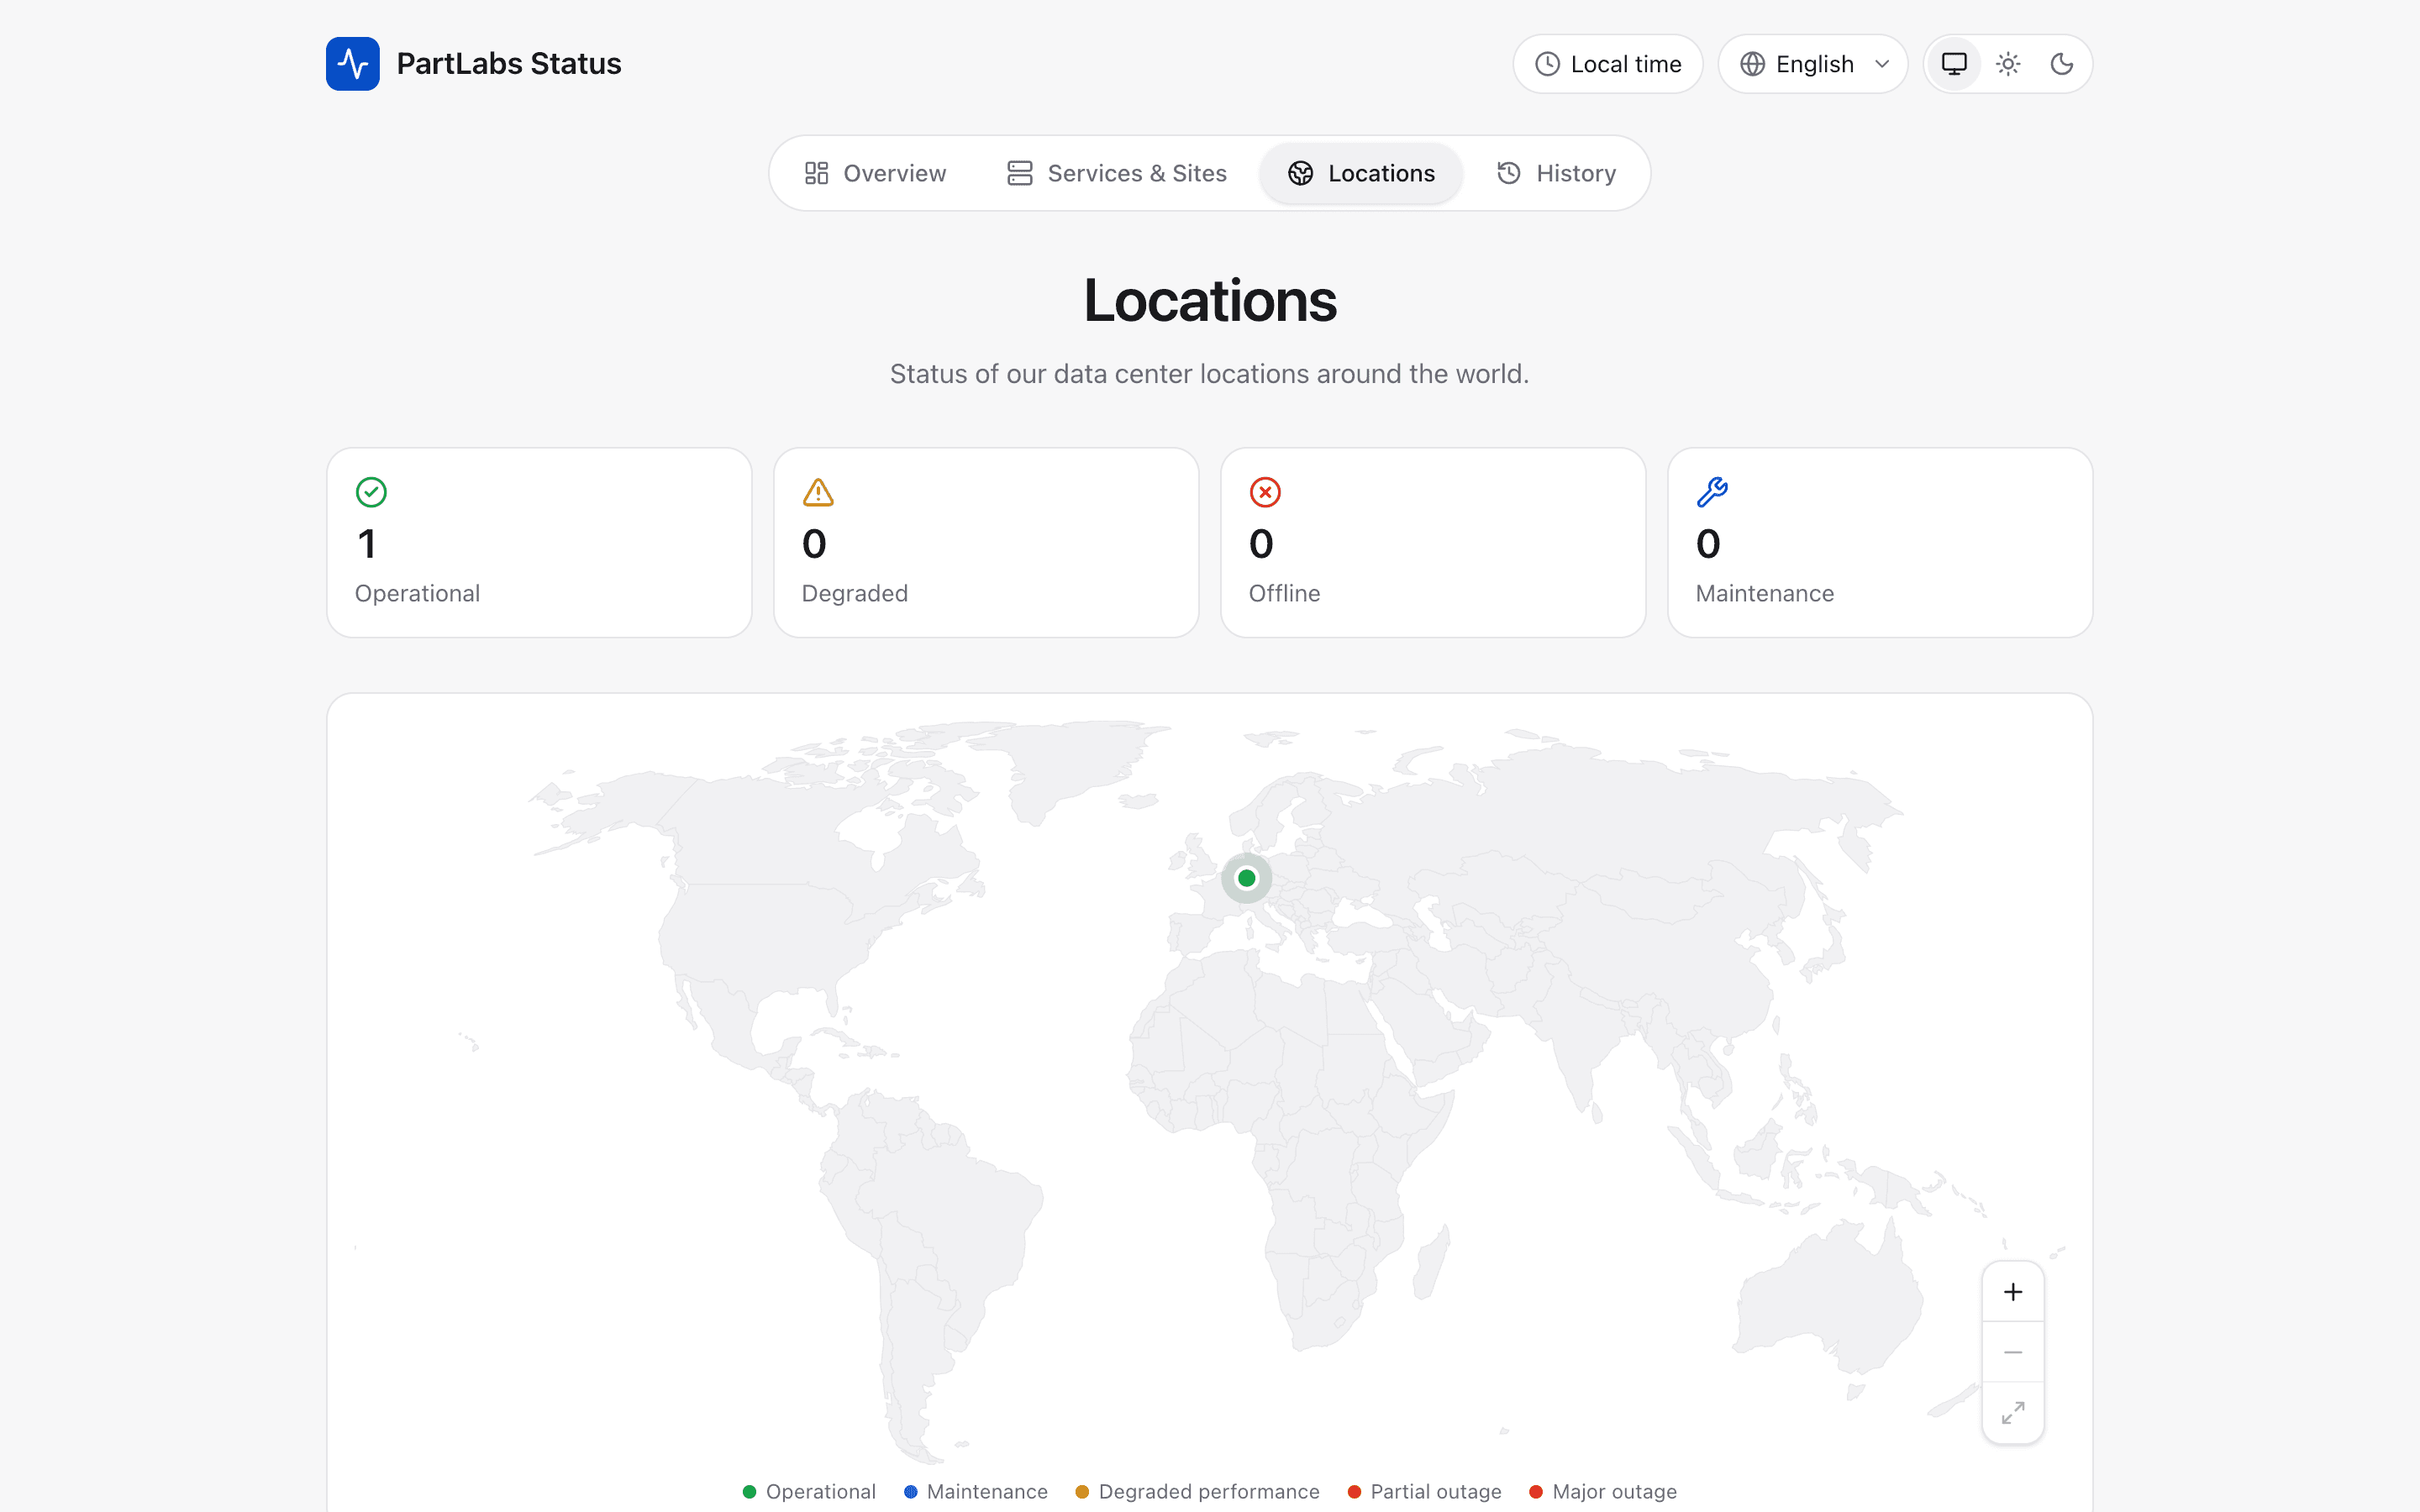
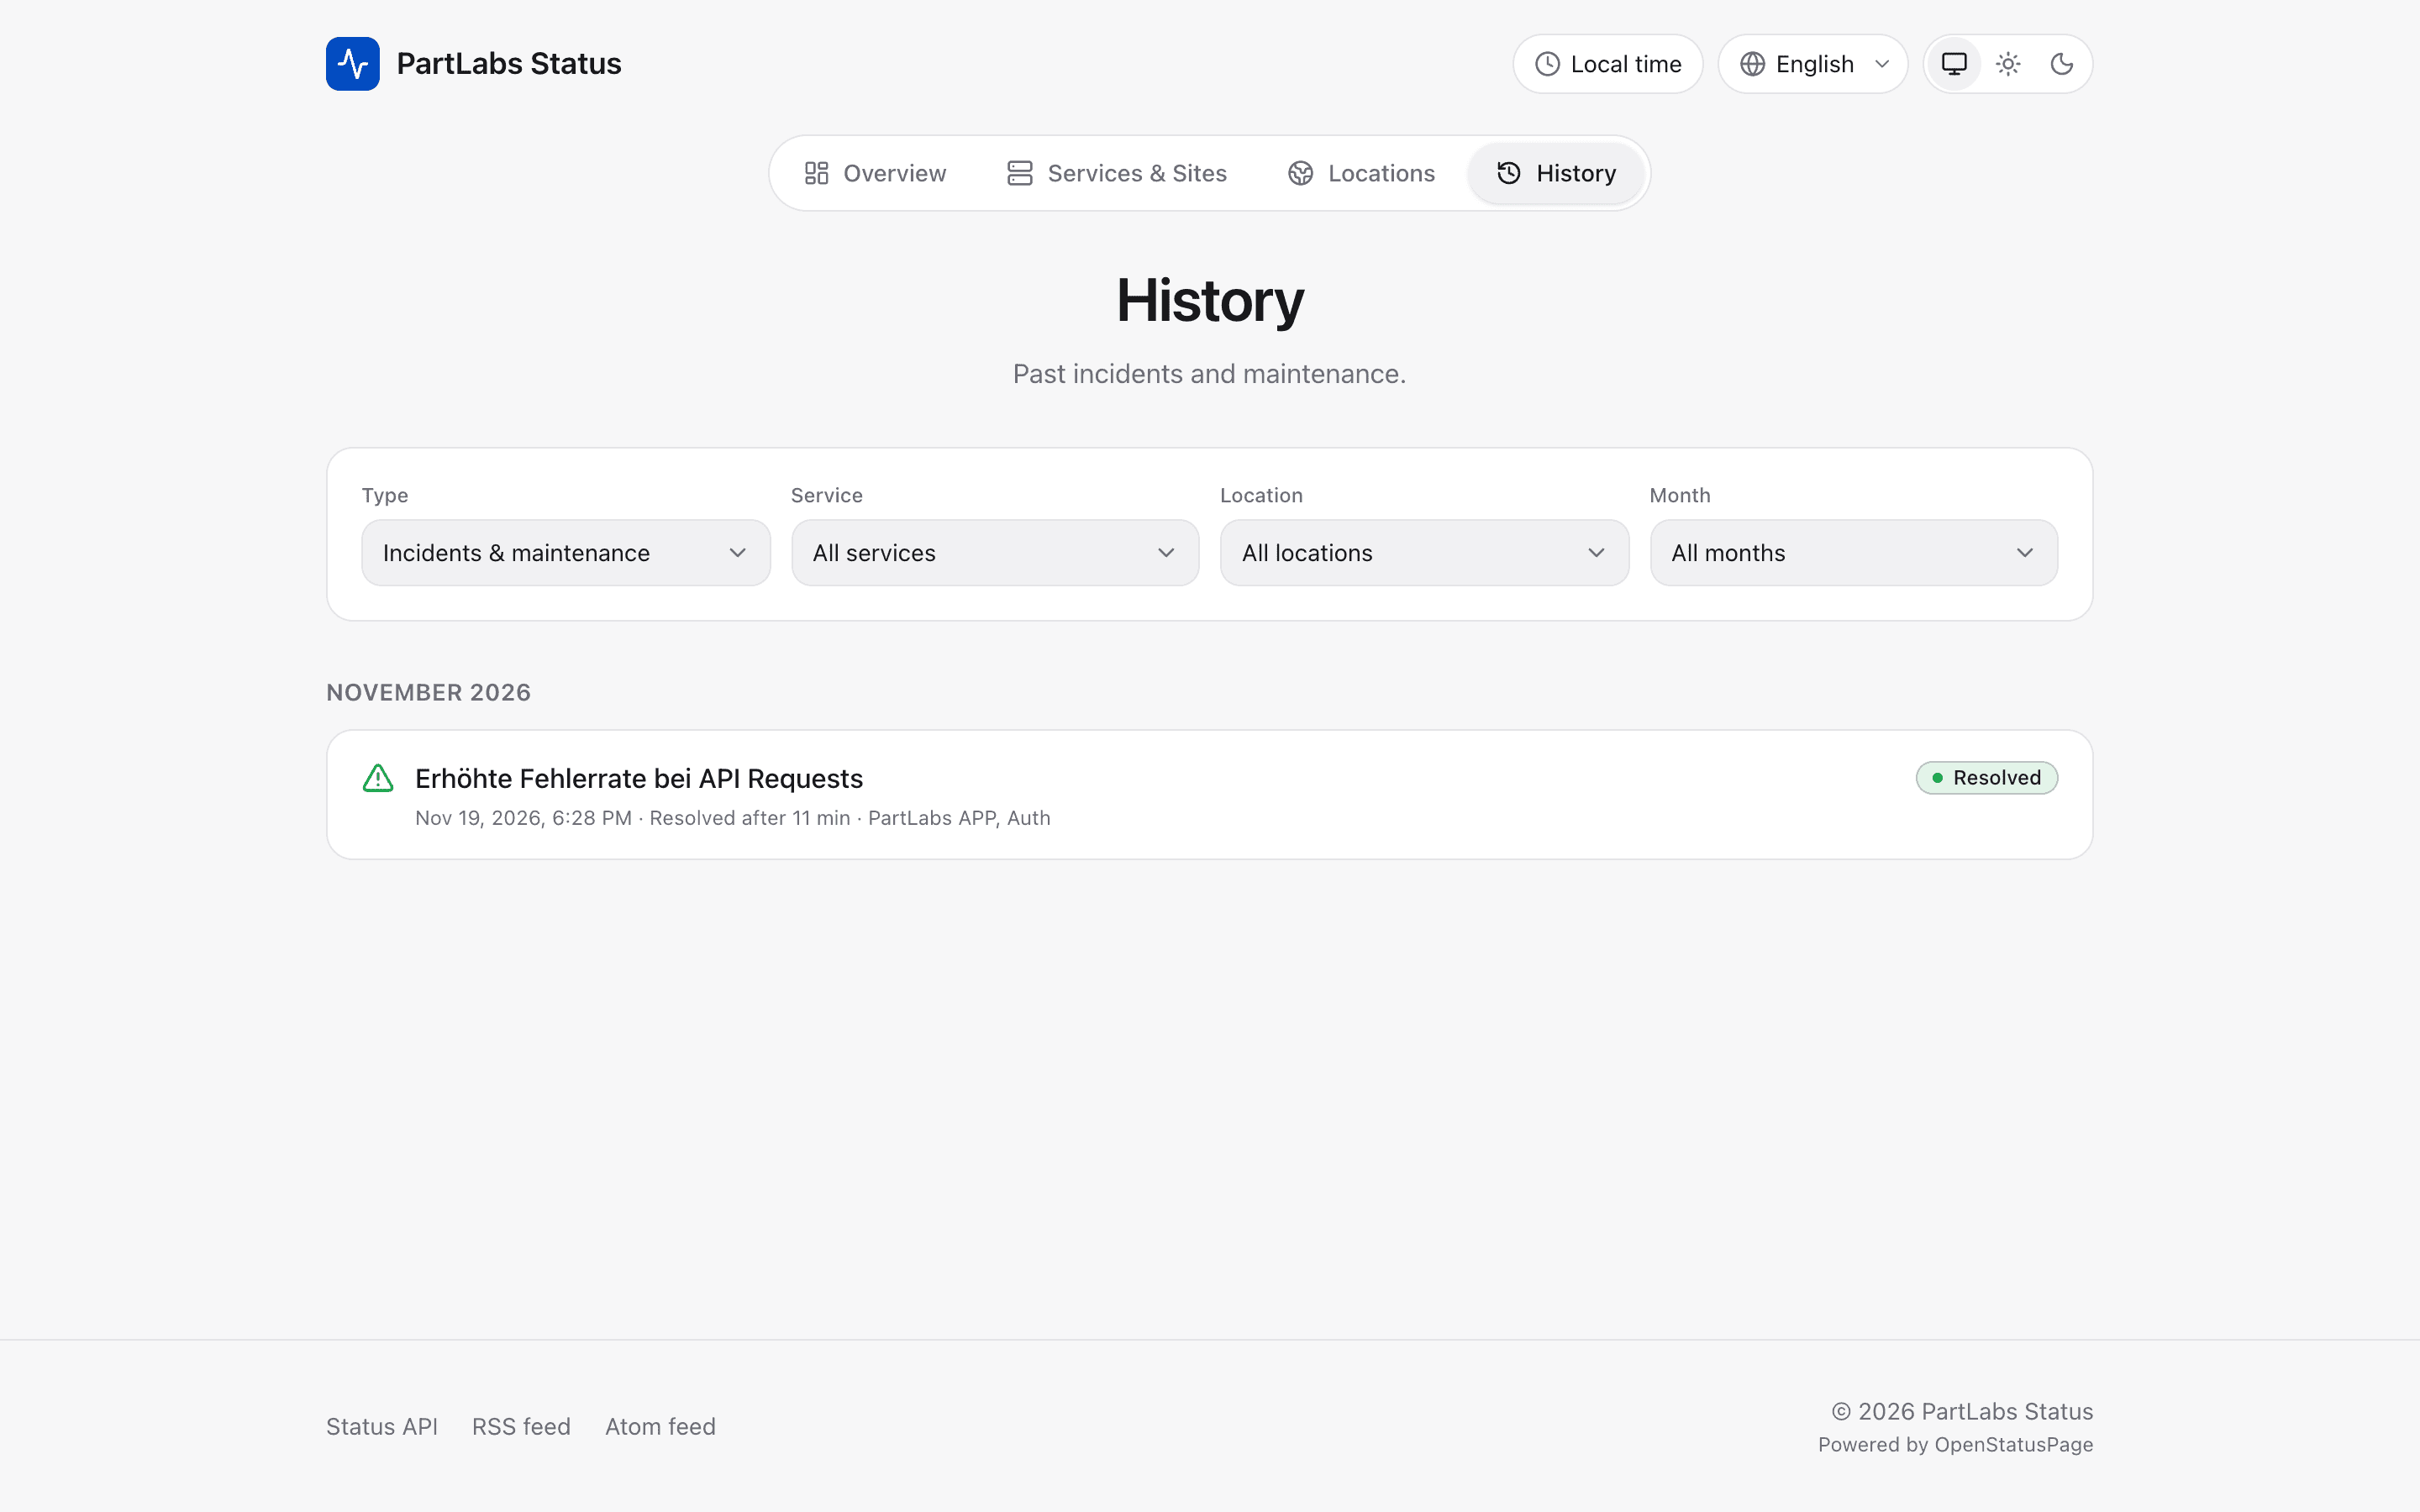
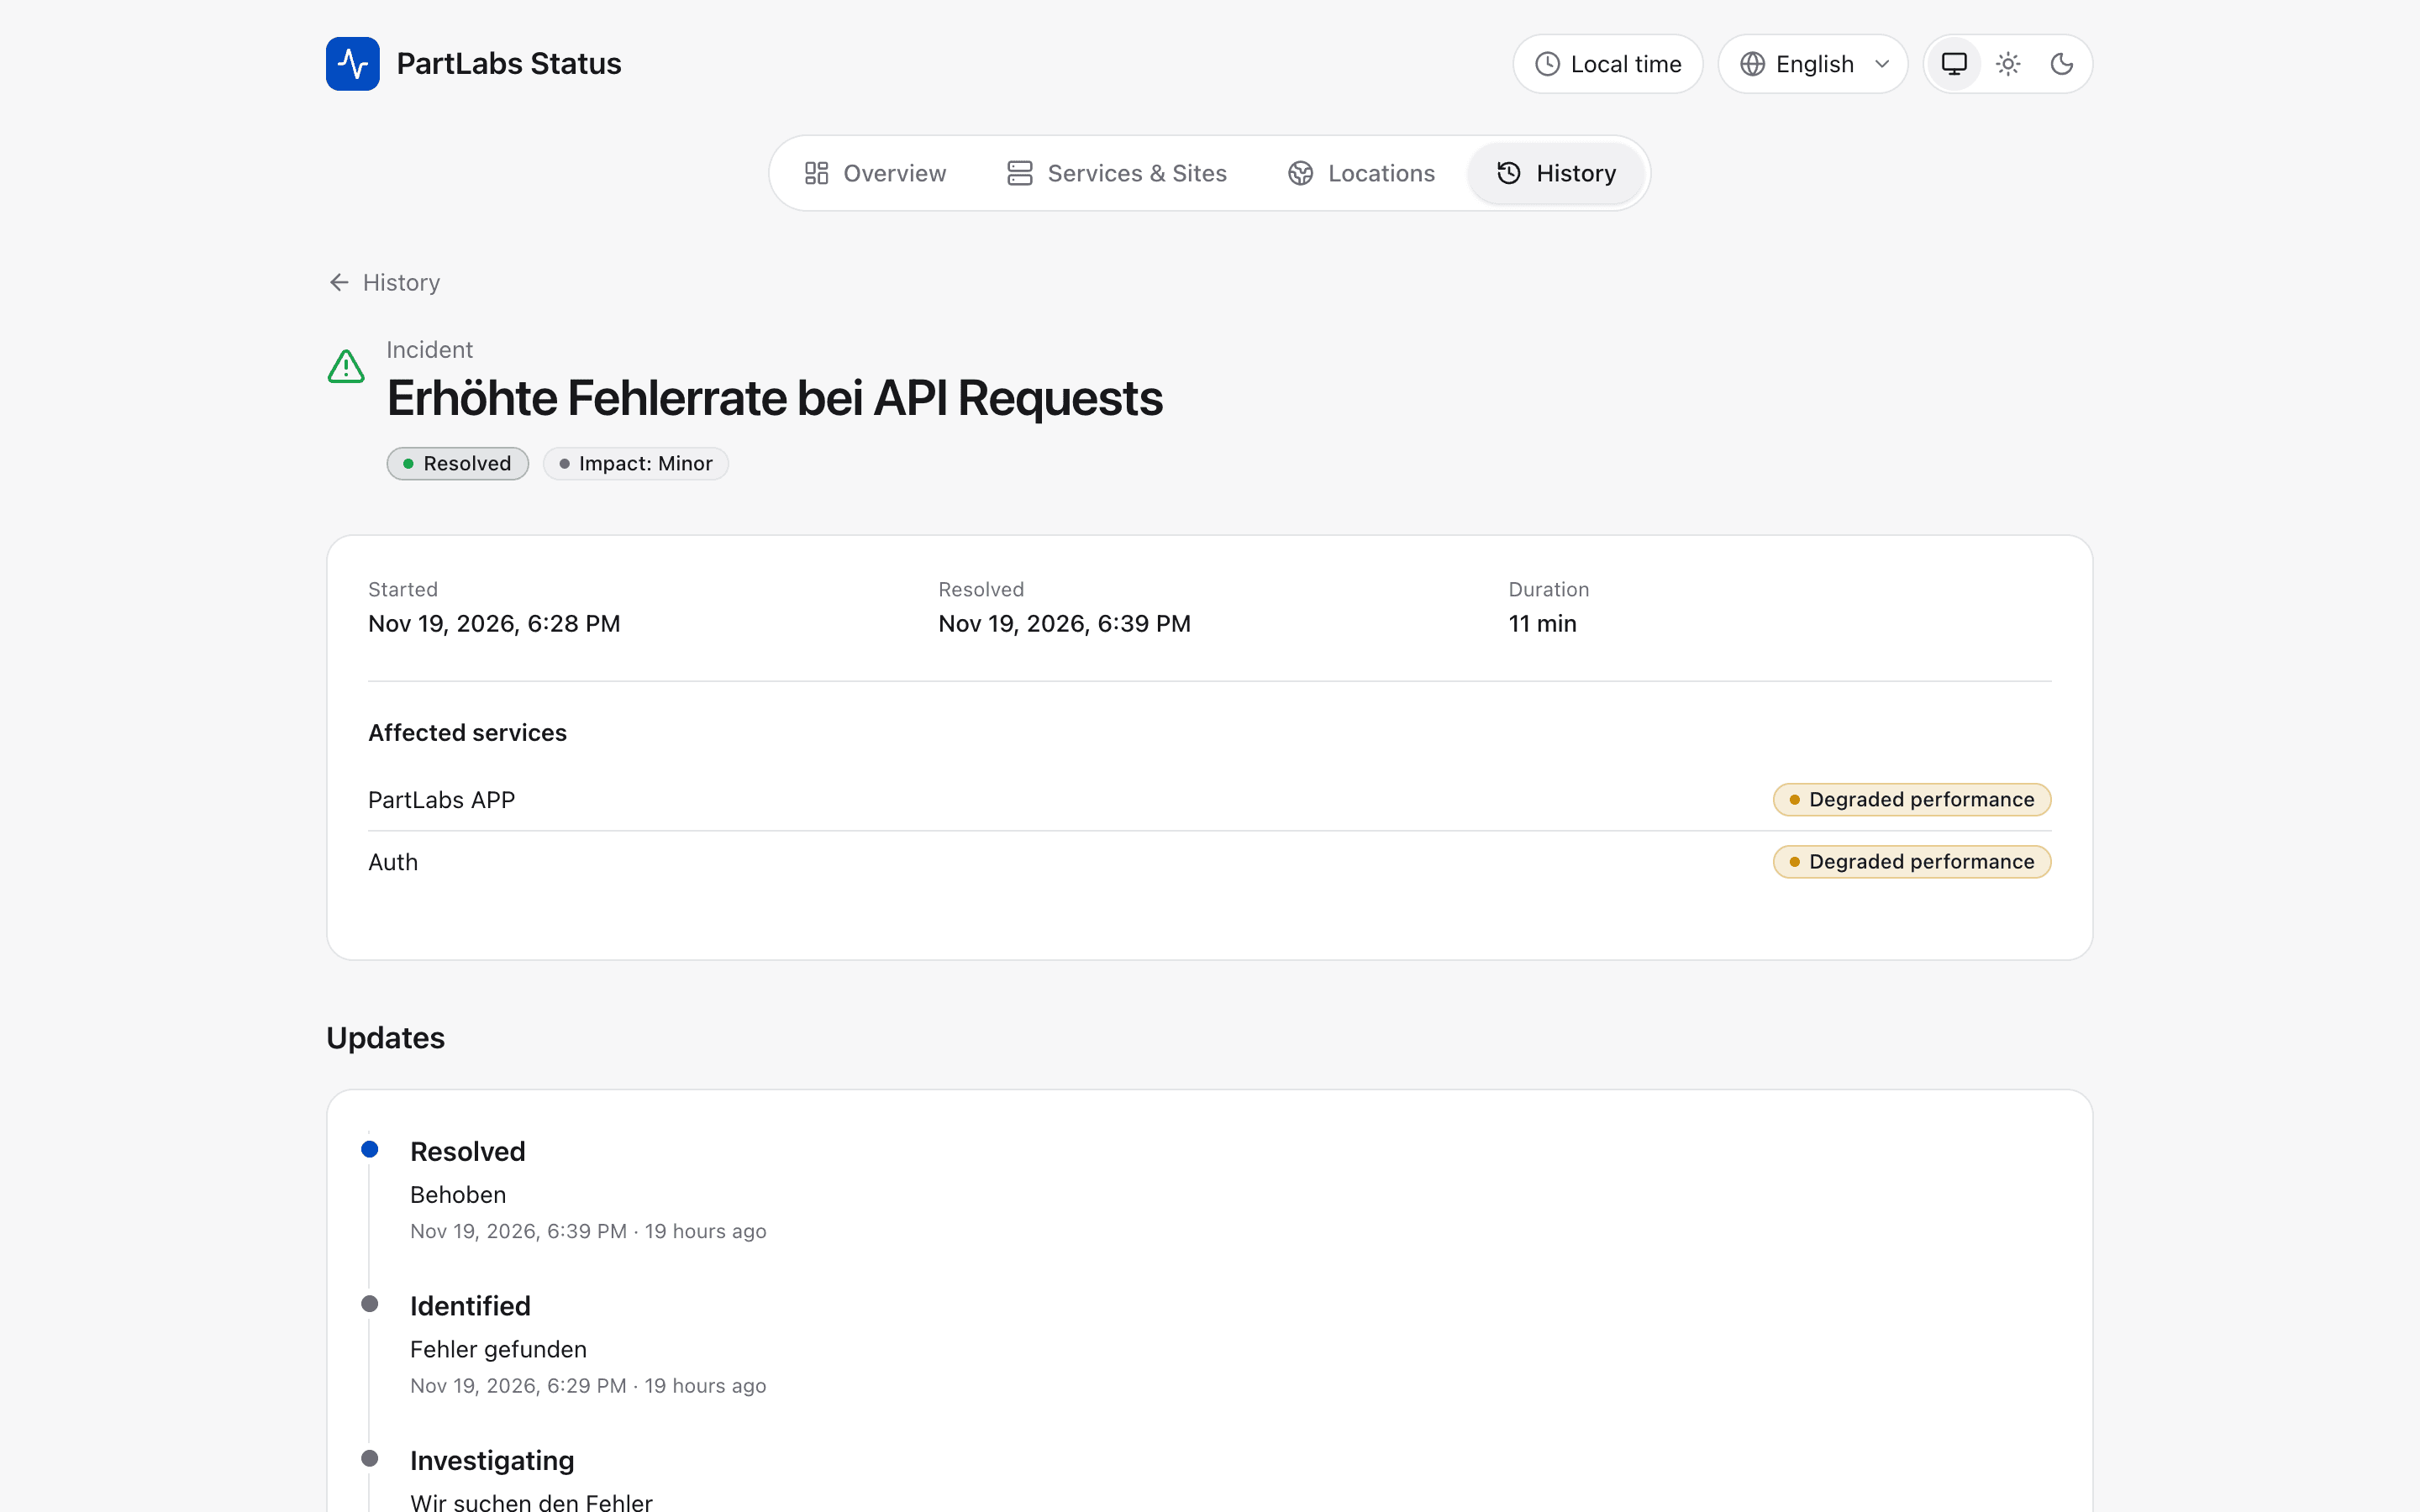
Every page ships in a light and a dark theme.
Everything important at a glance
The landing page of your status page shows the overall state, current incidents and active or upcoming maintenance in one place.
- Overall status visible immediately
- Current incidents and maintenance up front
- Server-rendered, works without JavaScript
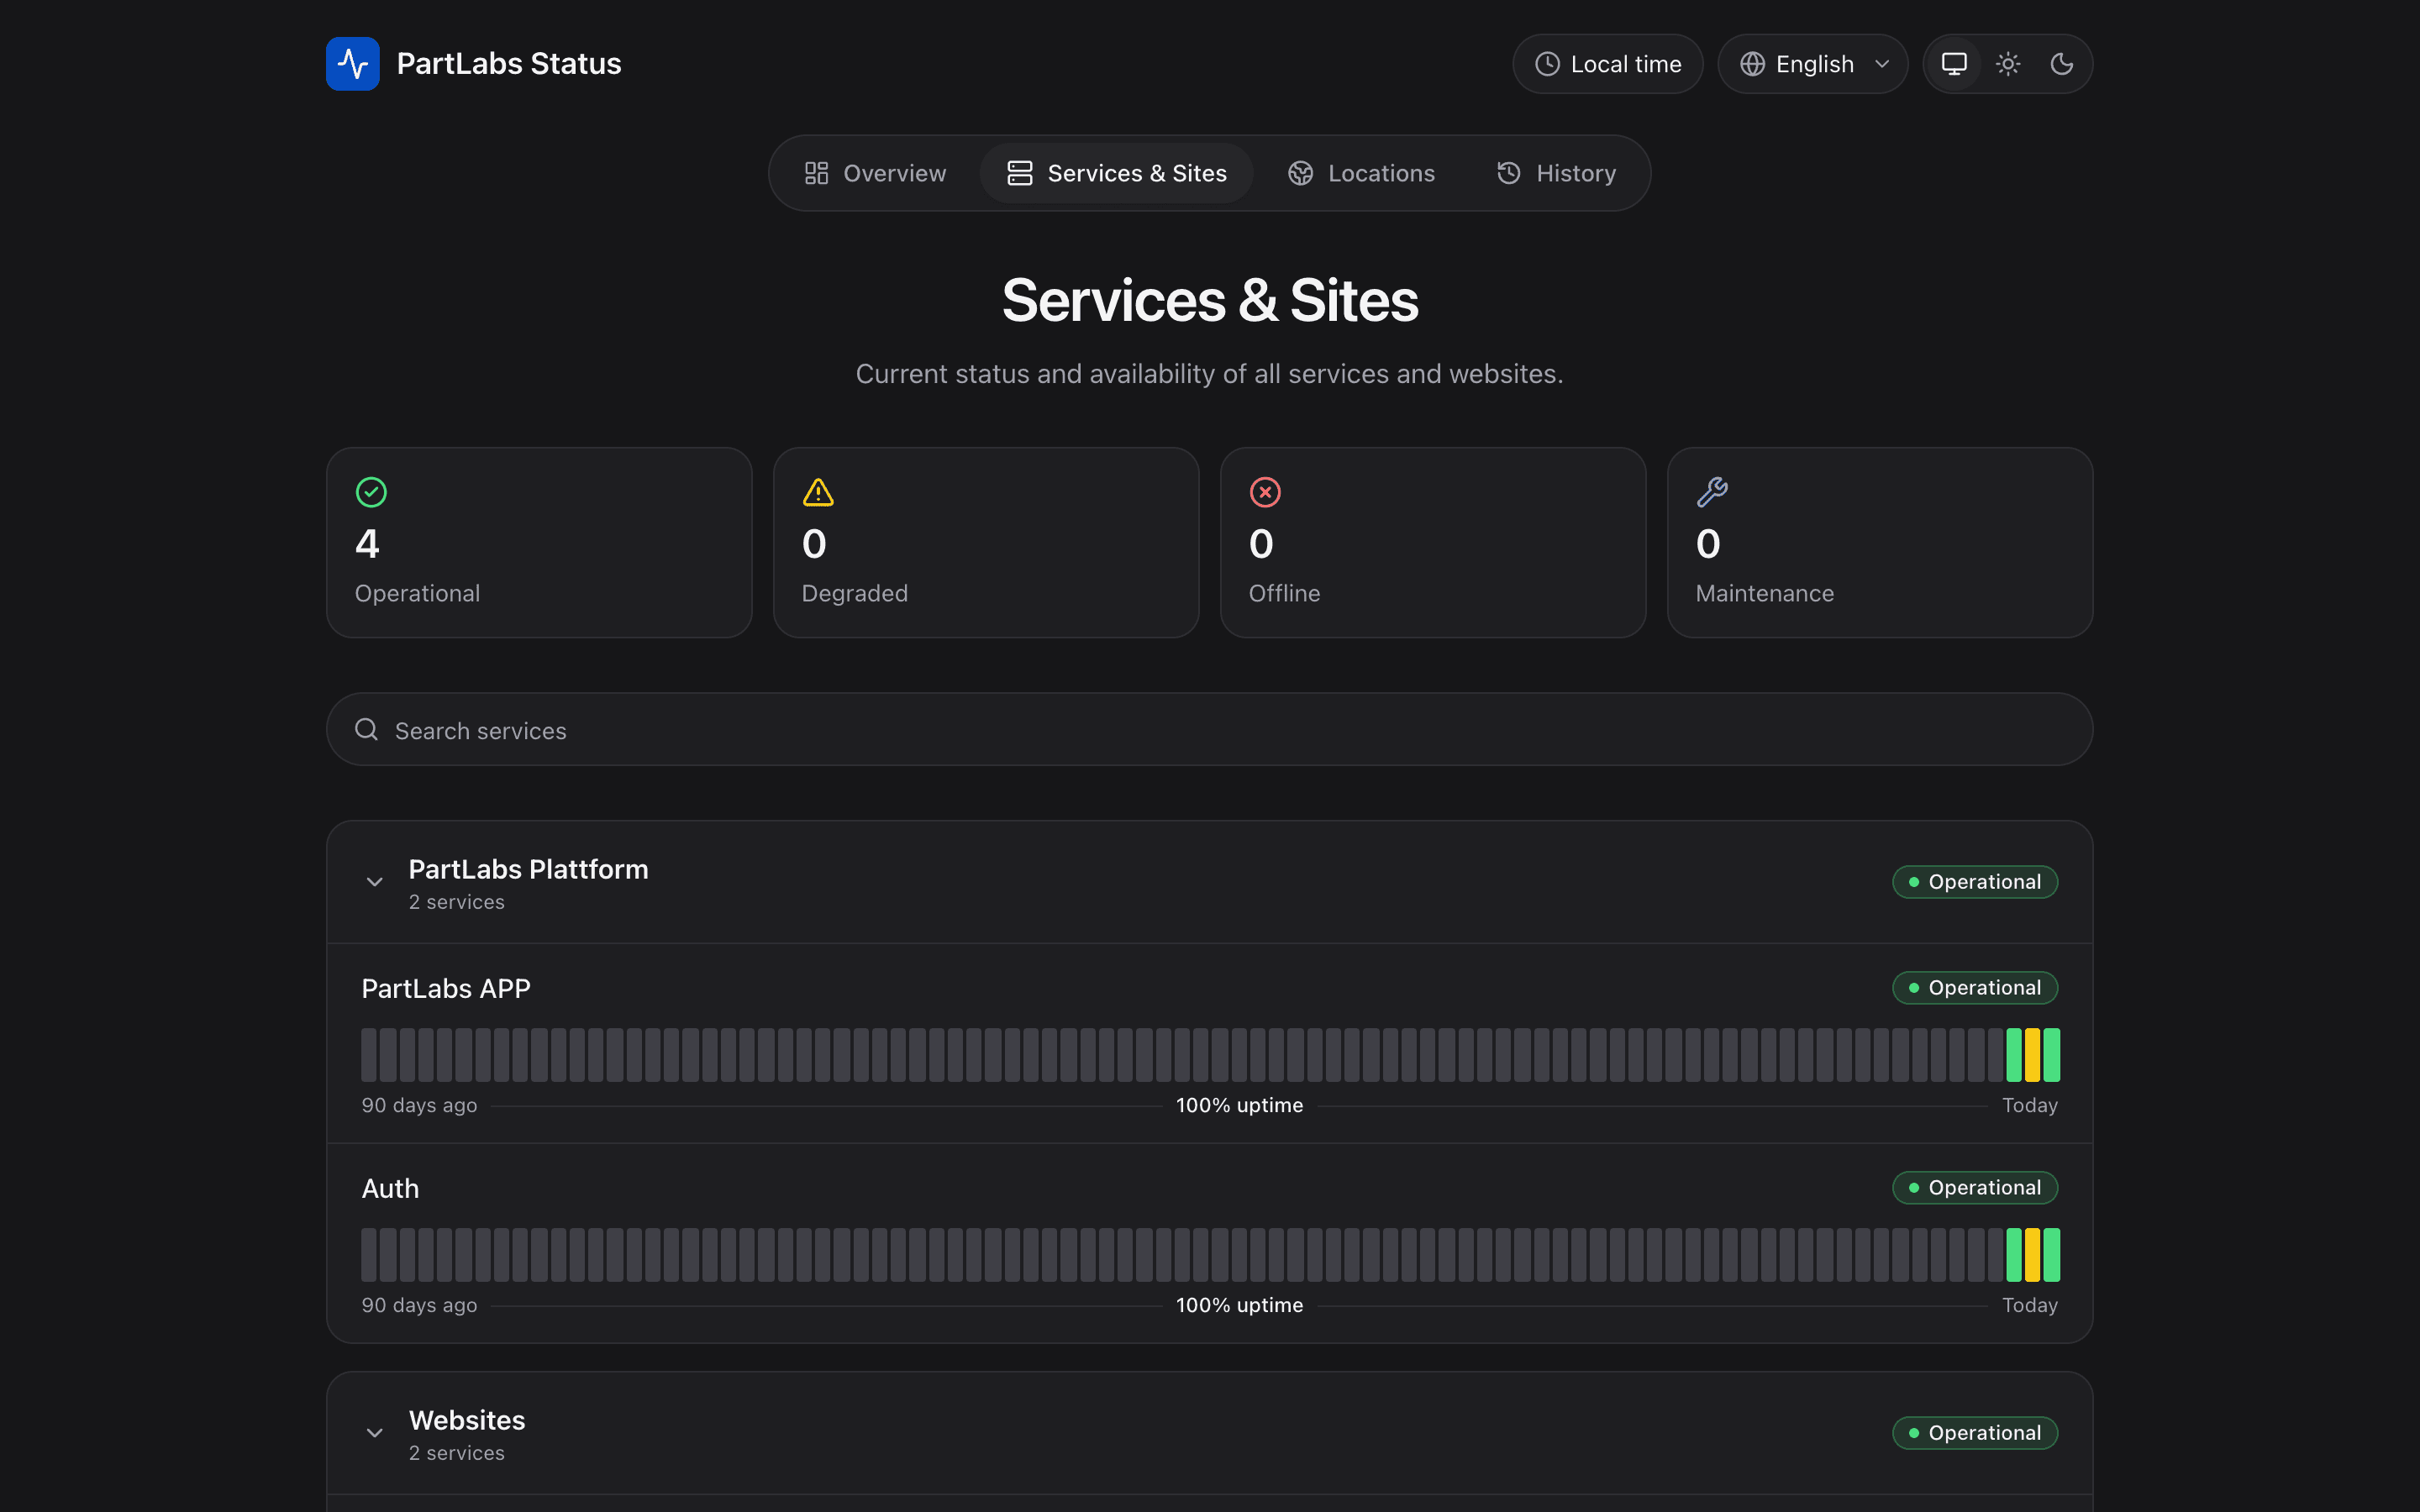
Services grouped the way your users think
Services and sites are grouped and each comes with a 90-day uptime bar. Behind every public service sit as many monitoring checks as you like.
- 90-day uptime bars per service
- Groups for products, teams or regions
- Check names and hosts stay private
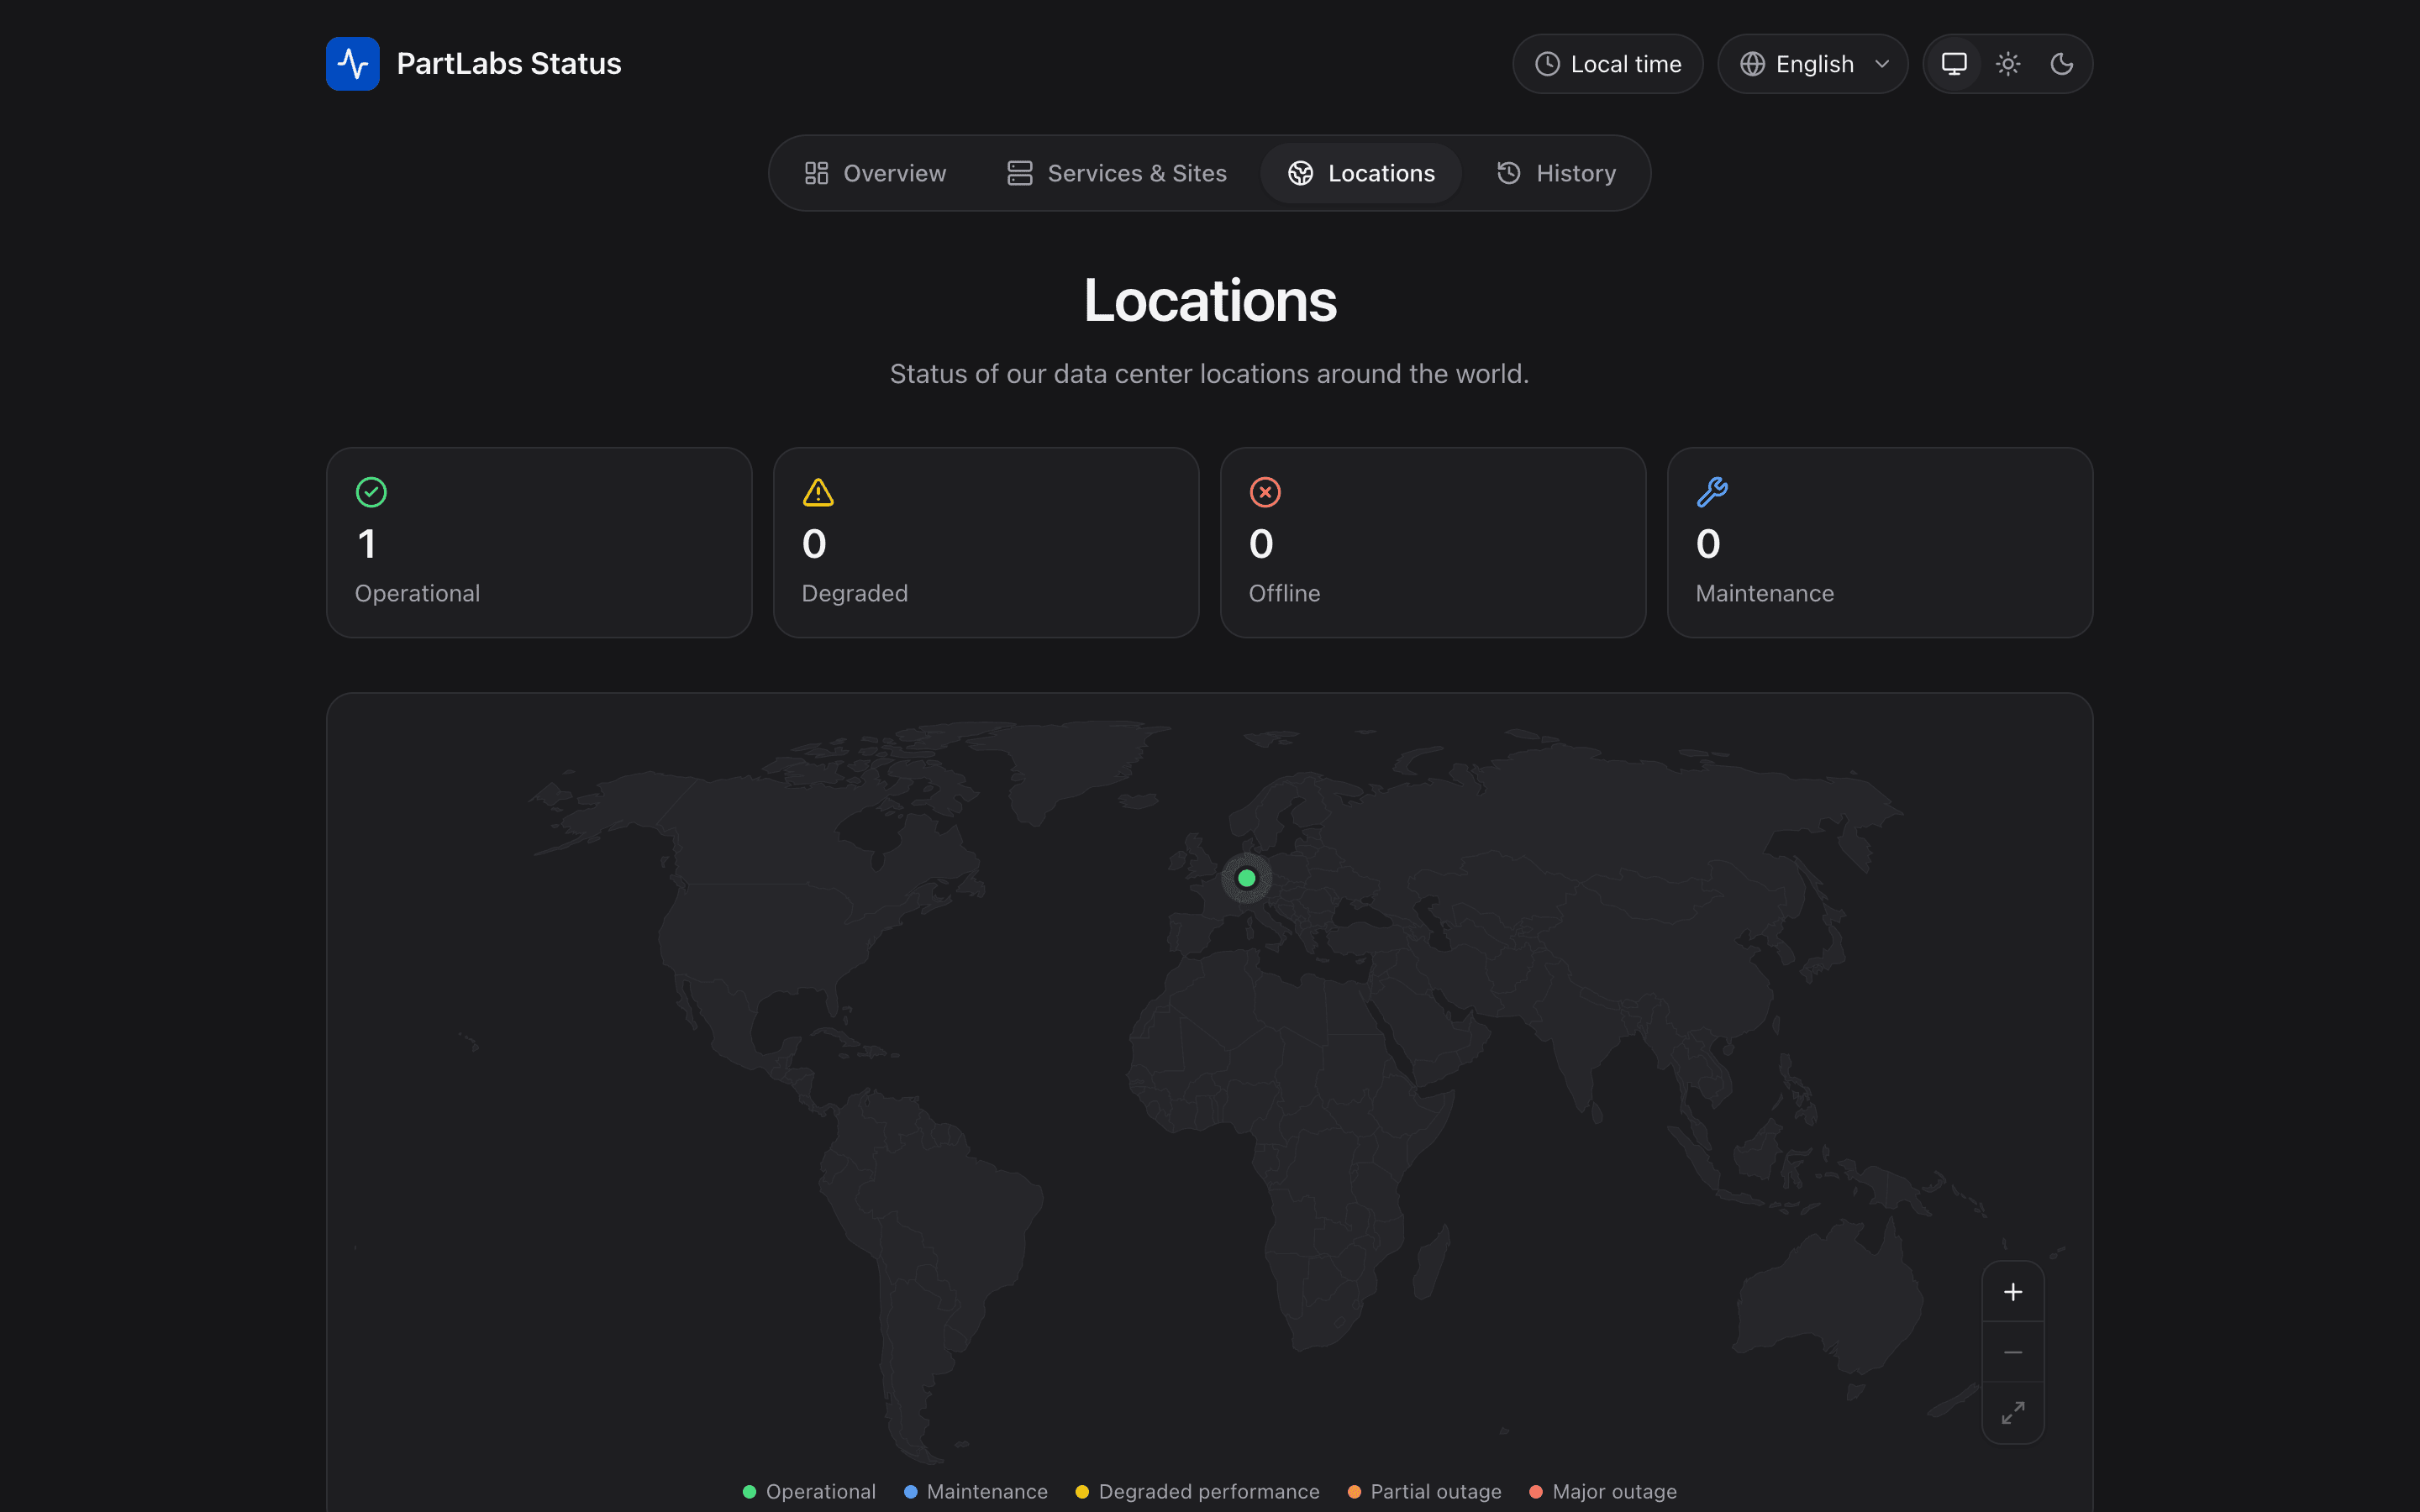
Your locations on a world map
Data centers, offices or edge sites appear on a world map with their live status, so affected regions stand out right away.
- Live status per location
- Affected regions are easy to spot
- Curated: you decide what is public
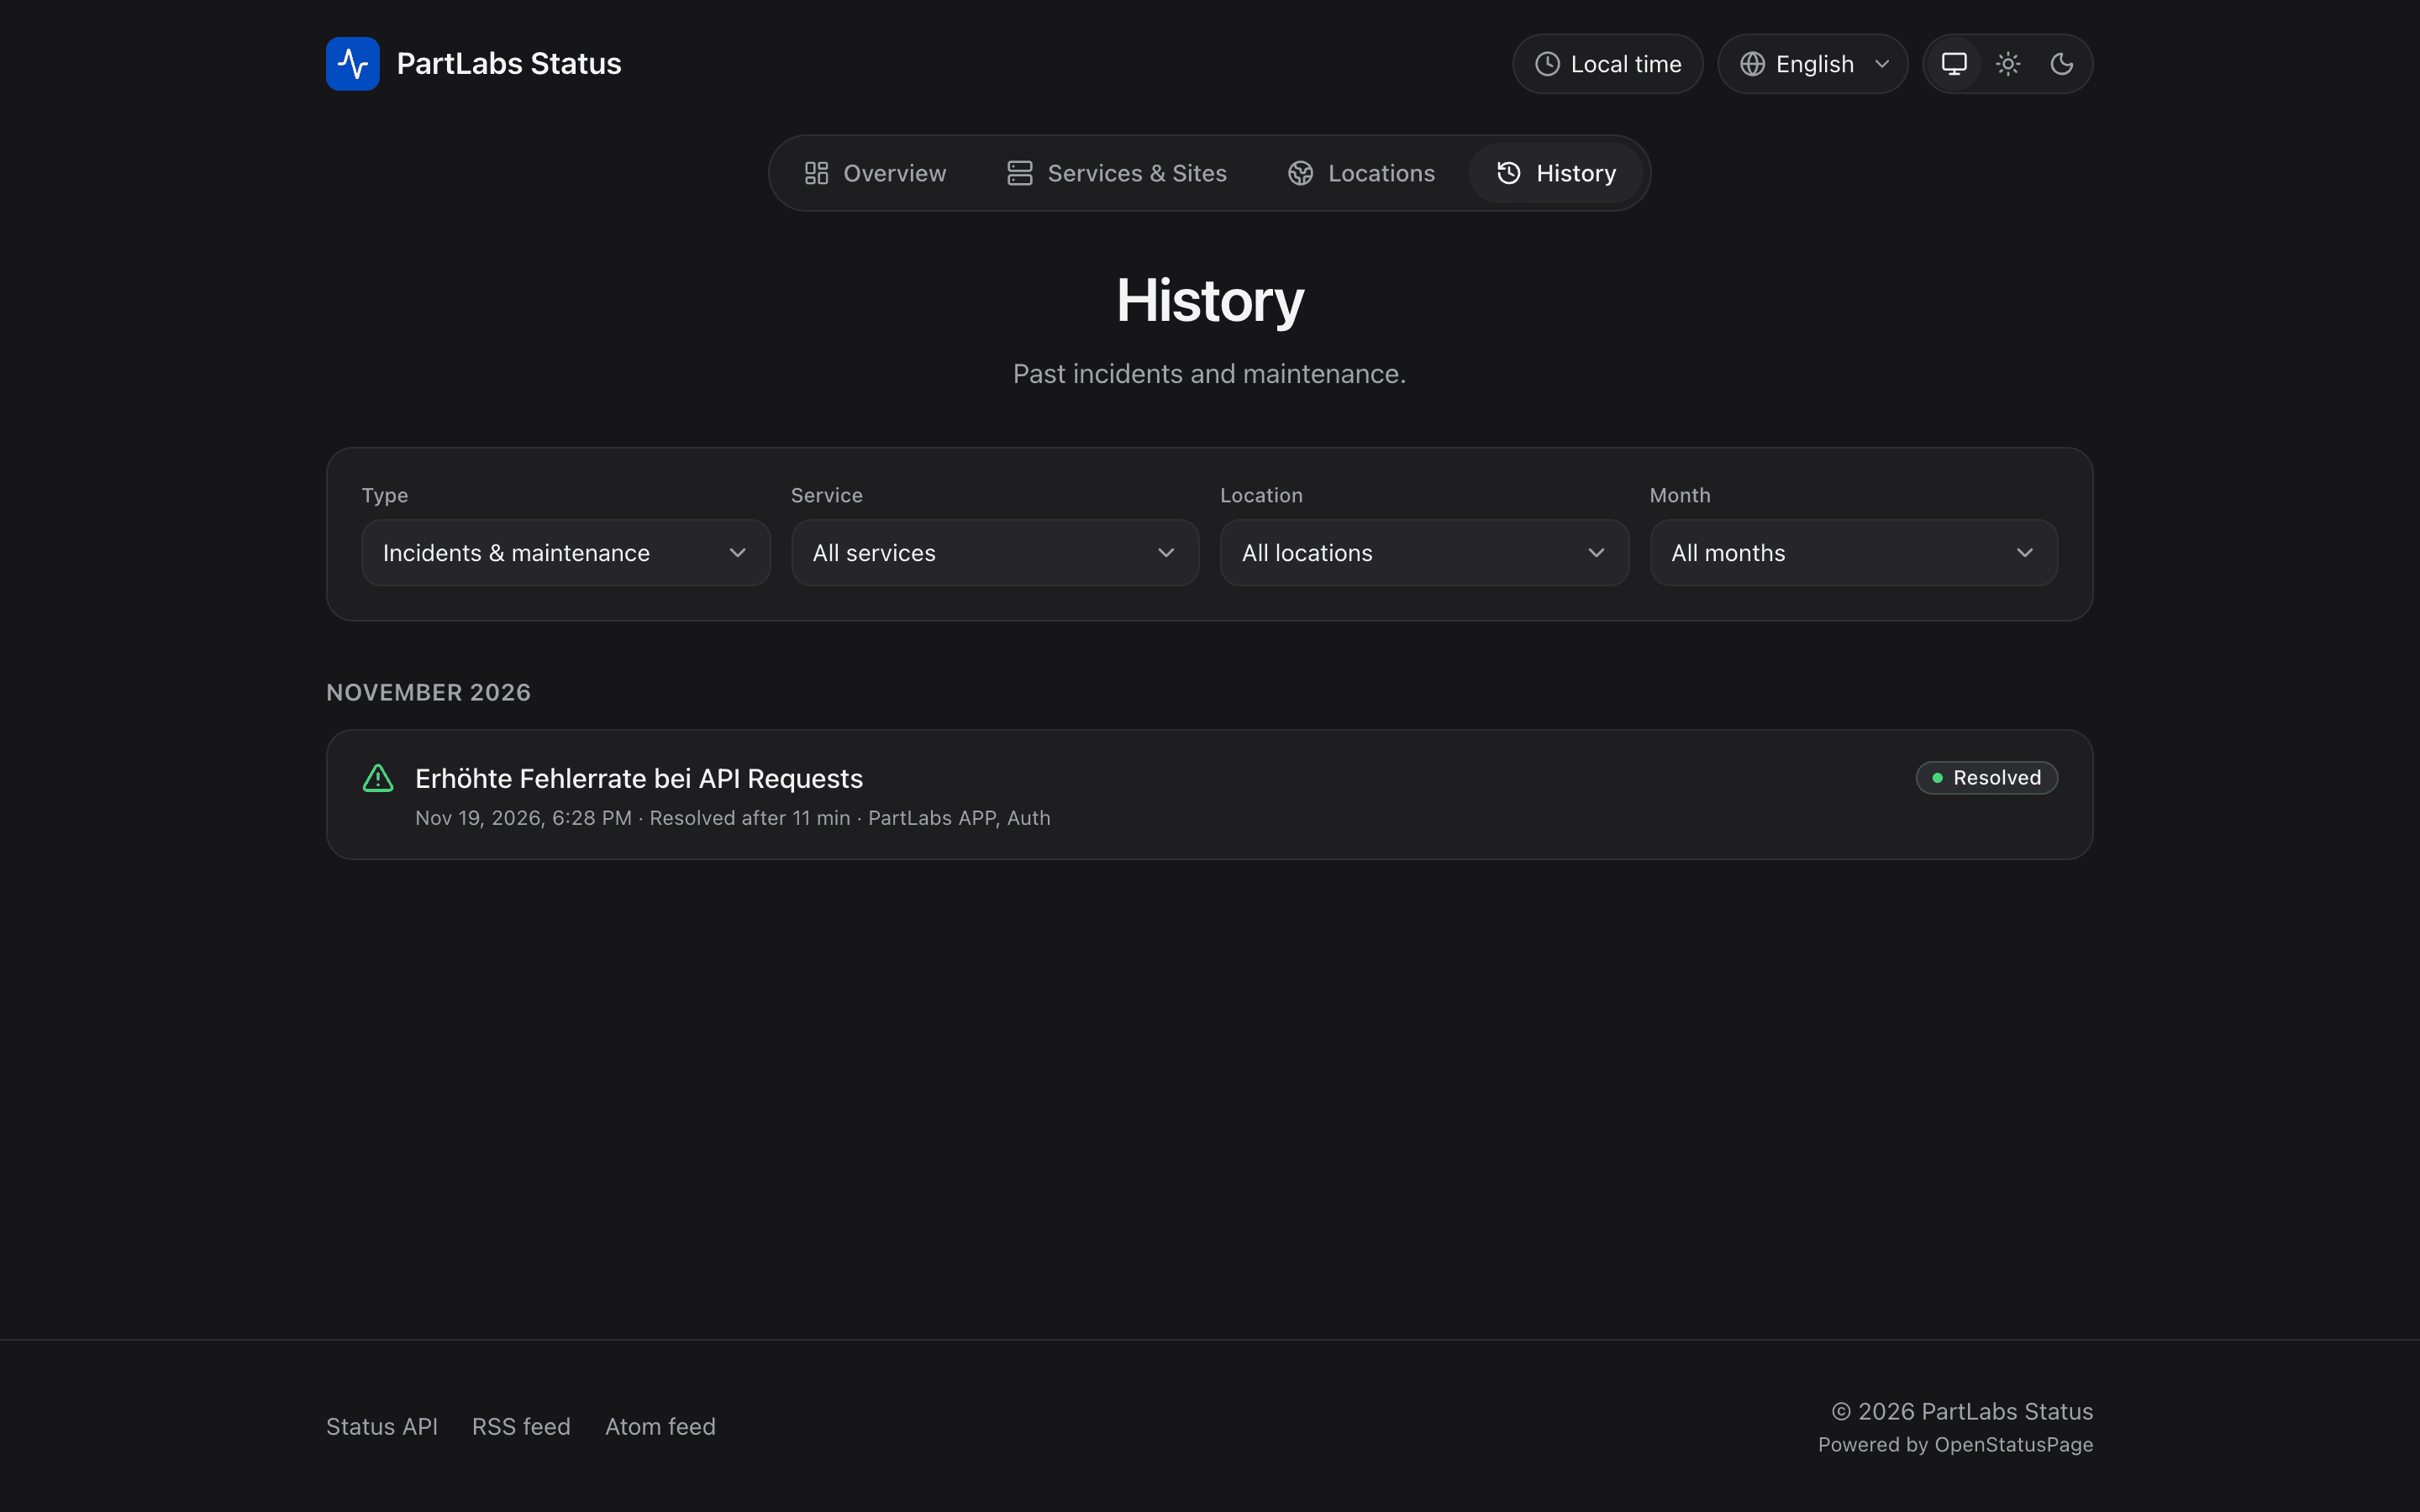
A transparent archive
Past incidents and maintenance windows live in a filterable history, so visitors can see how you handled things before.
- Filter incidents and maintenance
- Also available as RSS/Atom feeds
- Indexable pages with clean SEO
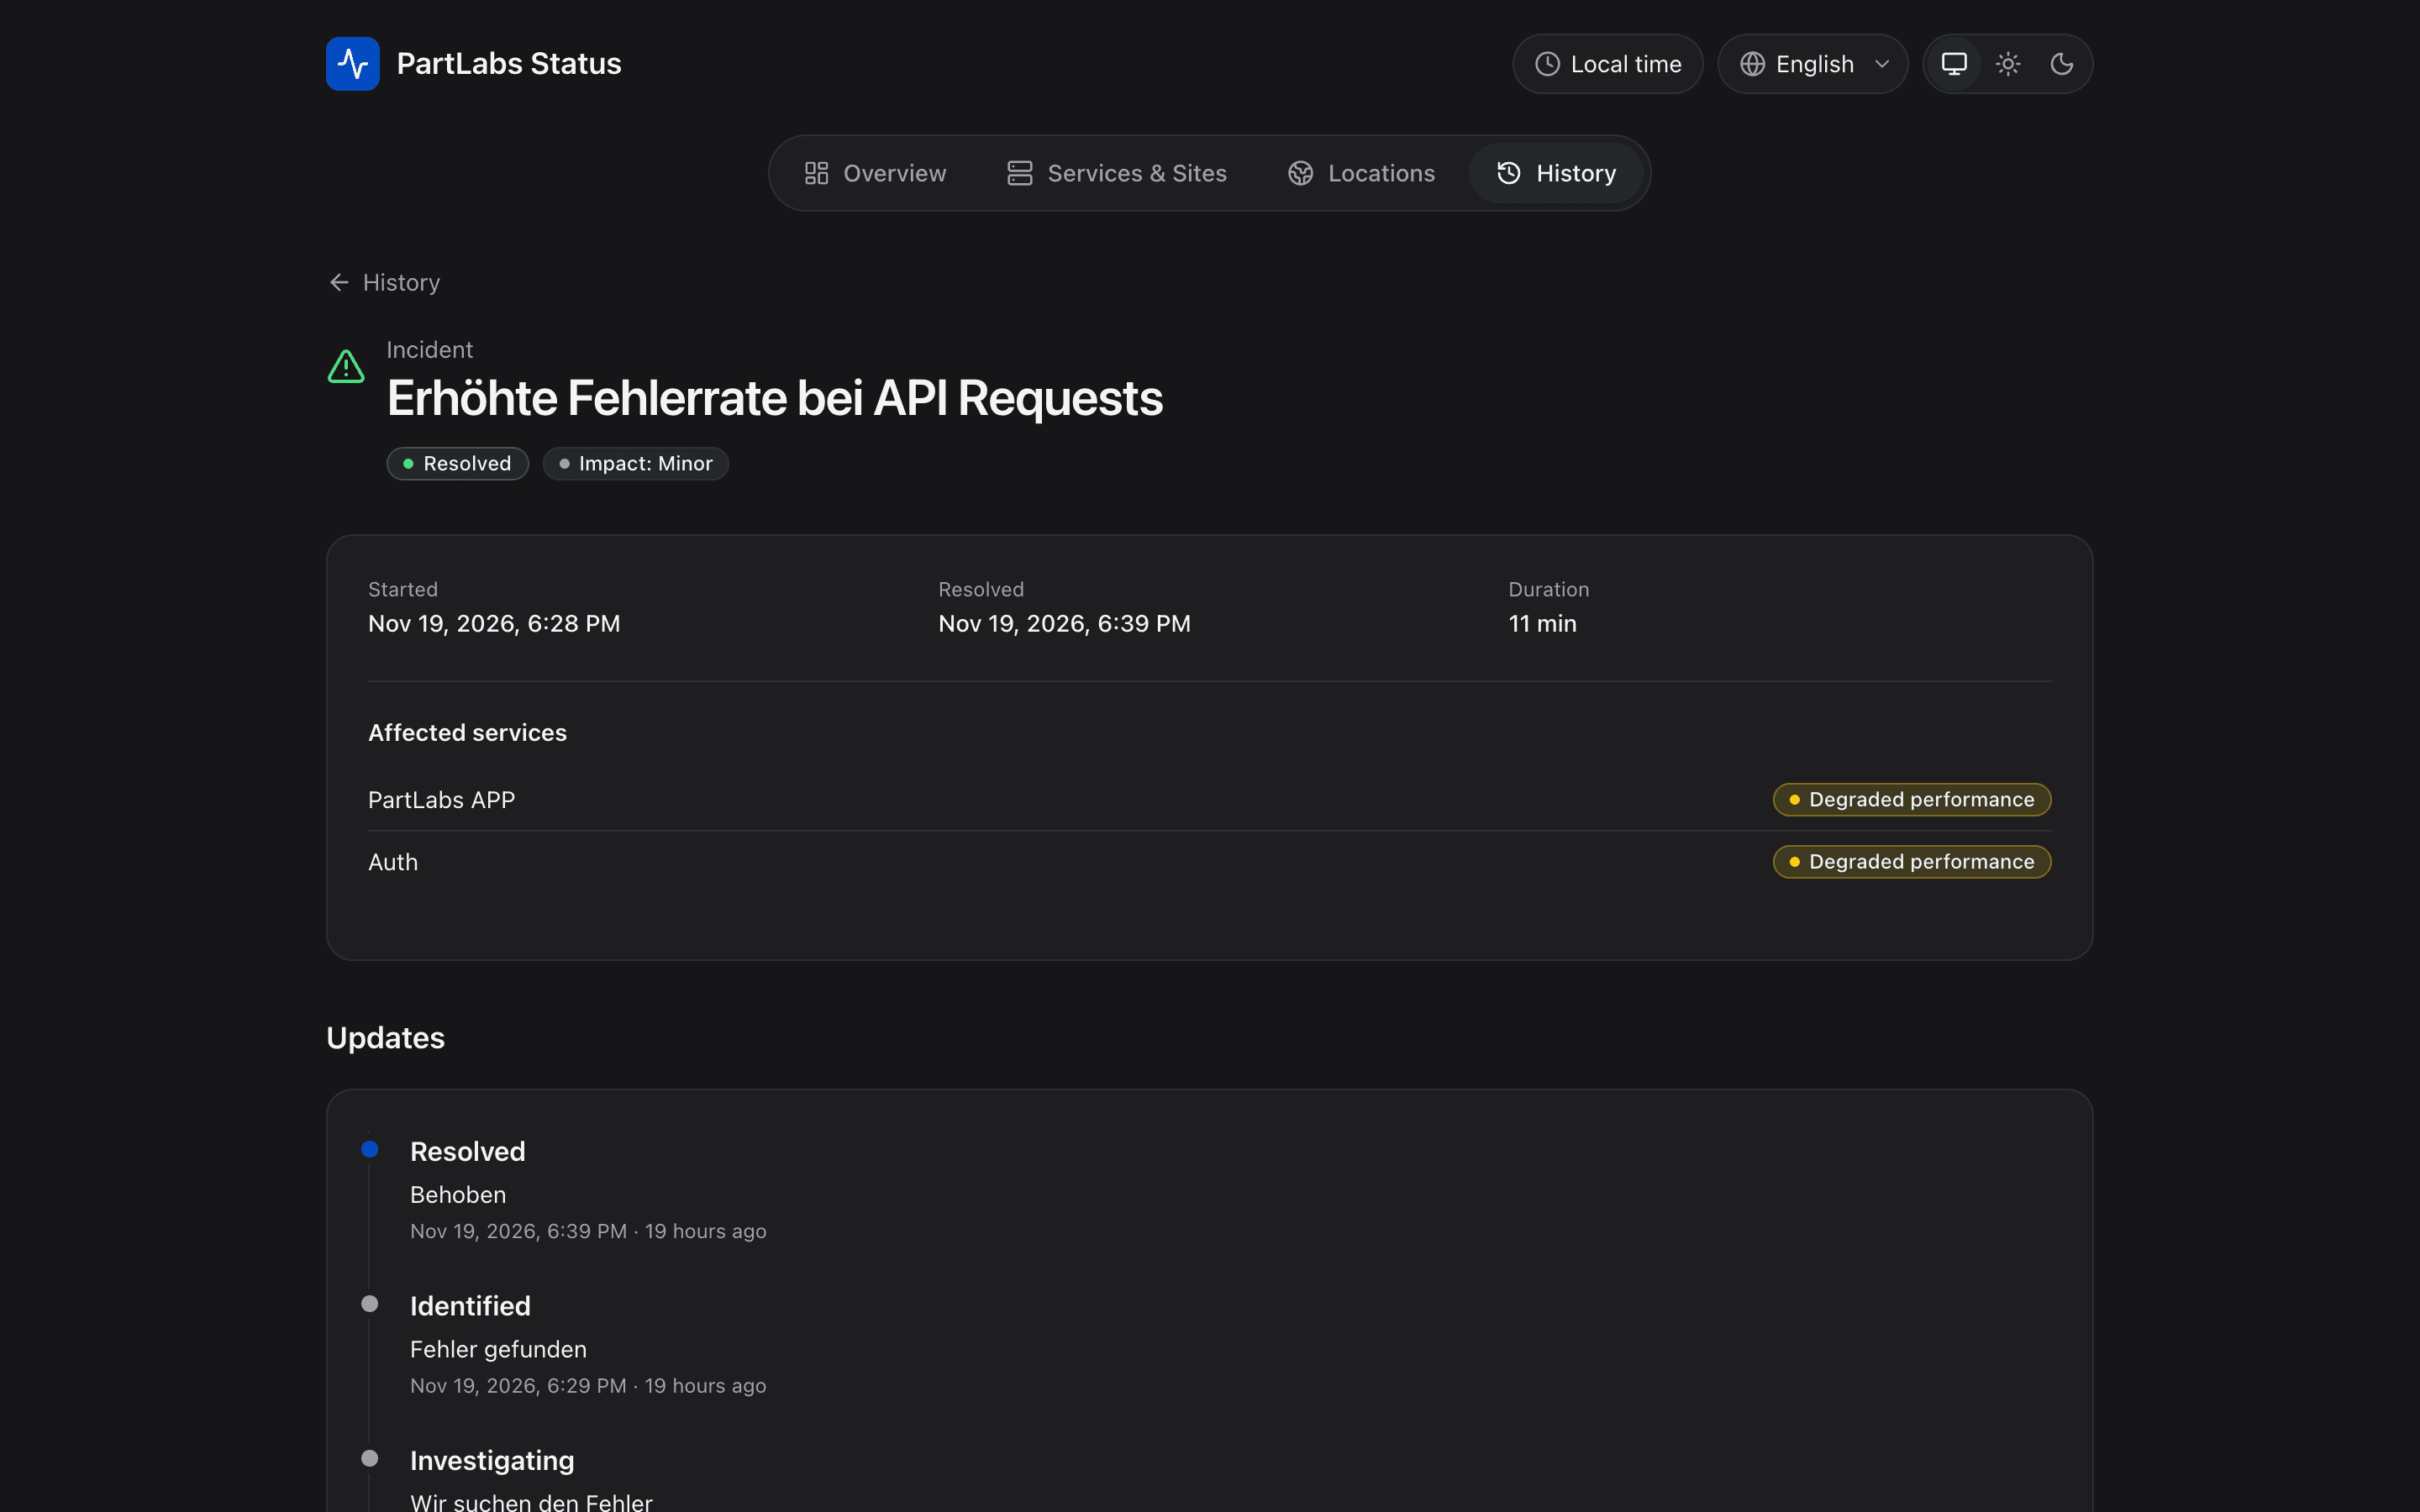
Every update in a clear timeline
Each incident gets its own page with all updates and the affected services. Subscribers hear about it by email.
- Timeline of all updates
- Affected services clearly listed
- Email notifications with double opt-in
Features
Everything a status page needs. Nothing it shouldn't show.
Built for teams that run their own monitoring and want a clean, honest public page on top of it.
Private by design
Visitors see curated services. Check names, hosts and outputs never leave the management area.
Service composition
Build each public service from any number of checks and decide how their states add up with aggregation rules.
Locations on a world map
Show data centers and sites on a map with their live status.
Check bundles with weighted voting
Several monitoring nodes, for example Uptime Kuma instances in different places, vote with weights on the state of one target. One flaky node no longer raises a false alarm.
90-day uptime bars
Services and sites grouped the way your users think about them, each with a 90-day history at a glance.
Email subscriptions
Visitors subscribe to all updates or just the services they care about.
- Double opt-in
- Maintenance reminders
- One-click unsubscribe
OIDC single sign-on
Local users with admin and editor roles, plus optional single sign-on via OIDC.
SQLite or PostgreSQL
Start with zero-config SQLite, switch to PostgreSQL when you need it.
English & German
Public page and management UI speak both languages.
Works without JavaScript
Every public page is rendered on the server. Fast, robust and readable anywhere.
Ready for search and AI agents
Unique titles, canonical and language links, JSON-LD, robots.txt, sitemaps and llms.txt.
JSON:API and feeds
A JSON:API 1.1 HTTP API plus RSS and Atom feeds for incidents and maintenance.
How it works
From internal checks to a public status page
Connect the monitoring you already run, decide what each public service is made of, and publish. Three steps, no data leaks.
- Step 01
Connect monitoring
Plug in the tools you already use. Adapters pull states automatically or accept pushes from anything that can send HTTP.
- Icinga 2
- Uptime Kuma
- openITCockpit
- Webhook· pull & push
- Step 02
Compose services
Map any number of internal checks to one public service. Aggregation rules decide the result; check bundles let several monitoring nodes vote with weights.
Public serviceCustomer portalRule: worst of- check A
- check B
- check C
Check bundlemajority · 2·1·1- node 1weight 2
- node 2weight 1
- node 3weight 1
3 : 1 →Example rules — aggregation is configurable per service.
- Step 03
Publish
Your visitors get a fast, server-rendered status page. Everyone else gets the same data where they need it.
- Public status pageOverview, services, locations, history
- Email subscribersDouble opt-in, per-service
- RSS / AtomIncidents and maintenance
- JSON:API 1.1Read status over HTTP
Private by design
Your infrastructure stays internal
The public page only knows what you curate. Everything that describes your actual setup stays in the management area.
Public sees
- Service and site names
- Current status
- Incidents and updates
- Maintenance windows
Internal only
- Check names
- Hostnames
- Check outputs
- Monitoring sources
Want an even harder boundary?
Run a split deployment: public page and admin on separate domains, a dedicated worker, and a read-only database role for the public side.
Quickstart
Up and running in minutes
Download the compose file of the latest release, generate secrets, set three variables and start the stack. No build step, no external services.
What you get
Multi-arch Docker images amd64 and arm64, published on ghcr.io.
Compose file per release App and PostgreSQL, ready to start.
SQLite for zero config Skip the database server for small setups.
Kubernetes manifests Example manifests, including a split deployment.
Your own reverse proxy Put it behind the proxy you already run, with HTTPS.
bash — openstatuspage
mkdir openstatuspage && cd openstatuspagecurl -fsSLO https://github.com/Raphael-Penning/openstatuspage/releases/latest/download/compose.yamlcurl -fsSL -o .env https://github.com/Raphael-Penning/openstatuspage/releases/latest/download/env.exampleprintf 'SECRET_KEY=%s\nPOSTGRES_PASSWORD=%s\n' "$(openssl rand -base64 48)" "$(openssl rand -hex 16)" >> .envchmod 600 .env# edit .env: BASE_URL, ADMIN_EMAIL, ADMIN_PASSWORDdocker compose up -dThen open BASE_URL/admin and log in.
JSON:API
curl -g -H "Authorization: Bearer $OSP_TOKEN" "https://status.example.com/api/admin/incidents?filter[status]=active&page[size]=10"Sponsors & users
Backed by people who run it in production
OpenStatusPage is independent and open source. These organisations fund its development or rely on it for their own status pages.
Sponsors
Funding development, the public demo and a project that stays AGPL.
- Pein GbR
- Sponsor
- User
- Get in touch
Become a sponsor
Sponsoring keeps OpenStatusPage moving and free for everyone.
- Funds ongoing development and maintenance
- Pays for hosting the public demo
- Keeps the project fully open under AGPL-3.0
Used by
Teams that host their own status page with OpenStatusPage.
Using OpenStatusPage?
Run it for your own status page? Let us know and we'll list you here.
FAQ
Questions, answered
The short version of what you probably want to know before you deploy.
Something missing? Ask on GitHub
Is OpenStatusPage free?
Yes. OpenStatusPage is open source under the AGPL-3.0 license and you host it yourself. No accounts, no seats, no paid tiers.
What do I need to run it?
Docker with Compose or a Kubernetes cluster, plus a reverse proxy that terminates HTTPS. SQLite works with zero configuration; for larger setups you can switch to PostgreSQL. Every release ships a compose.yaml with the app and PostgreSQL.
Which monitoring tools are supported?
Icinga 2, Uptime Kuma and openITCockpit out of the box, plus a generic webhook adapter that can pull or receive pushes from anything else. Several monitoring nodes can vote with weights on the state of one target.
Will visitors see my hostnames or check outputs?
No. Visitors only see the services, sites and locations you curate. Check names, hosts and outputs stay inside the management area: private by design.
Can my customers subscribe to updates?
Yes. Email subscriptions use double opt-in and can cover all updates or only selected services, including maintenance reminders and one-click unsubscribe. RSS and Atom feeds are available too.
Does it support single sign-on?
Yes. Besides local users with admin and editor roles, you can connect any OpenID Connect (OIDC) provider for single sign-on.
Is there an API?
Yes, an HTTP API following JSON:API 1.1. Everything public is also available as RSS and Atom feeds.
Read the API docsIs it production ready?
Honestly: OpenStatusPage is in early development. Releases are versioned and every change is documented, so check the changelog and test an upgrade before you roll it out.
View the changelogWhich languages are available?
English and German, for both the public status page and the management UI.
Self-hosted · Open source
Give your customers a status page they can trust
Connect the monitoring you already run, decide what the public sees and keep your infrastructure private. Up and running with a single compose file.
Find us at openstatuspage.dev